SEO dashboard template
A six-widget layout for monitoring search performance from Google Search Console — the view you check between reports. Download the wireframe and the widget spec, then build it in Looker Studio, Google Sheets or your BI tool.
Free, no sign-up.
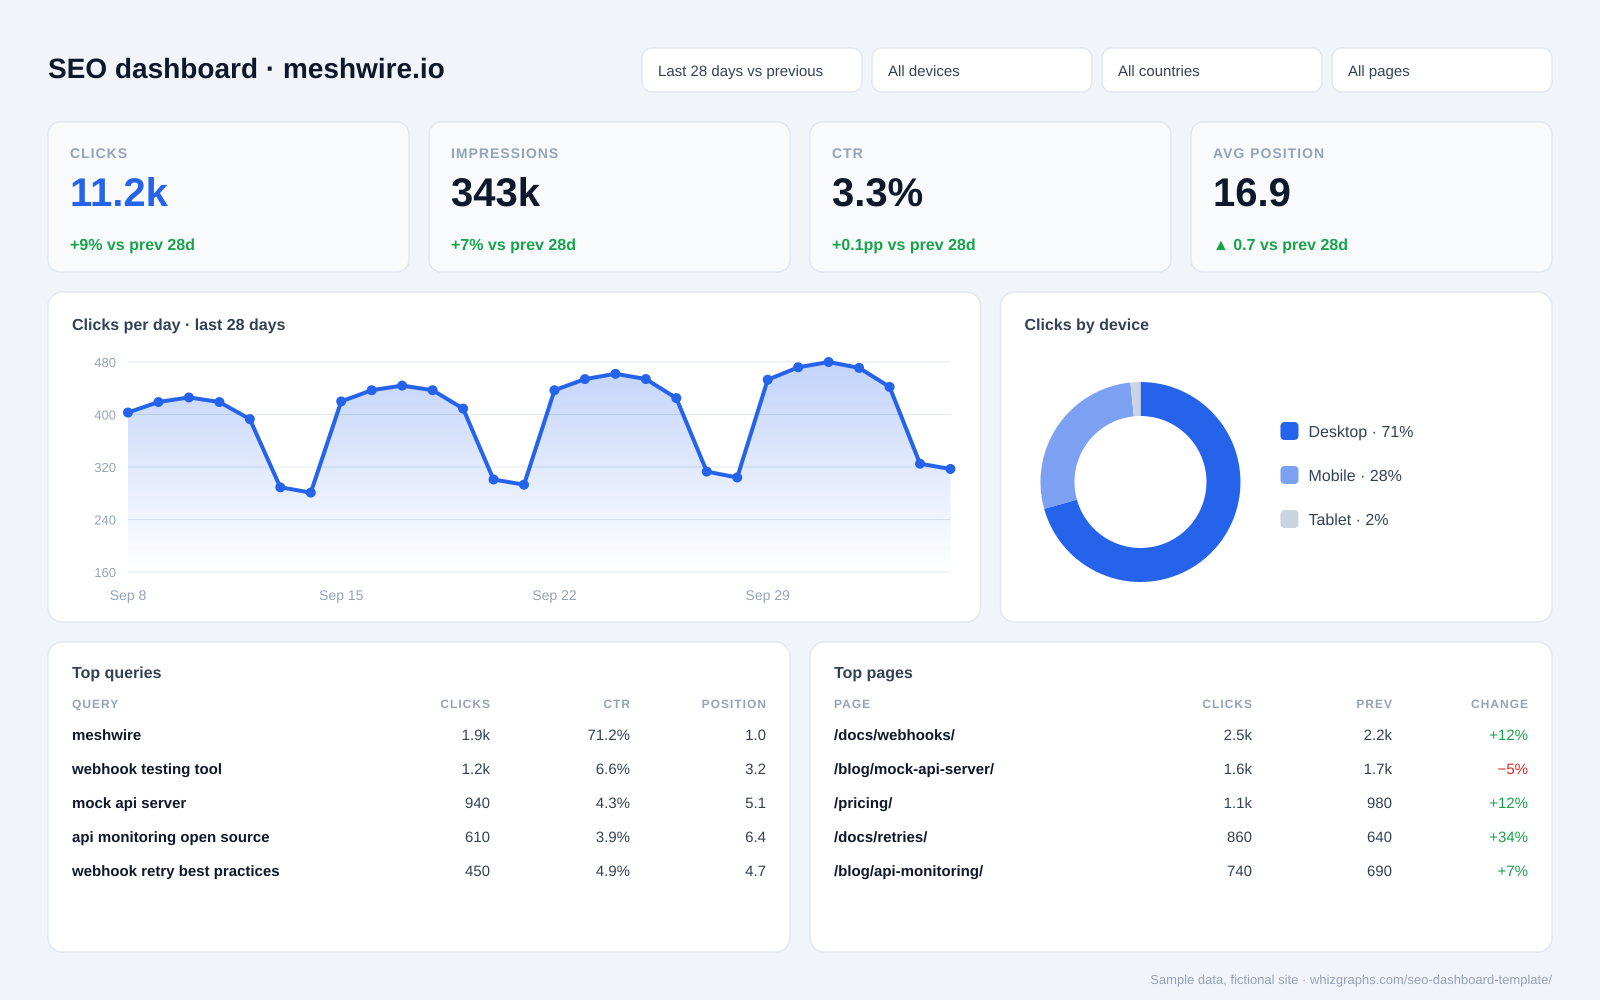
Six widgets, in the order people read them
Top to bottom: what am I looking at (filters), how are we doing (scorecards), since when (trend), and why (devices, queries, pages).
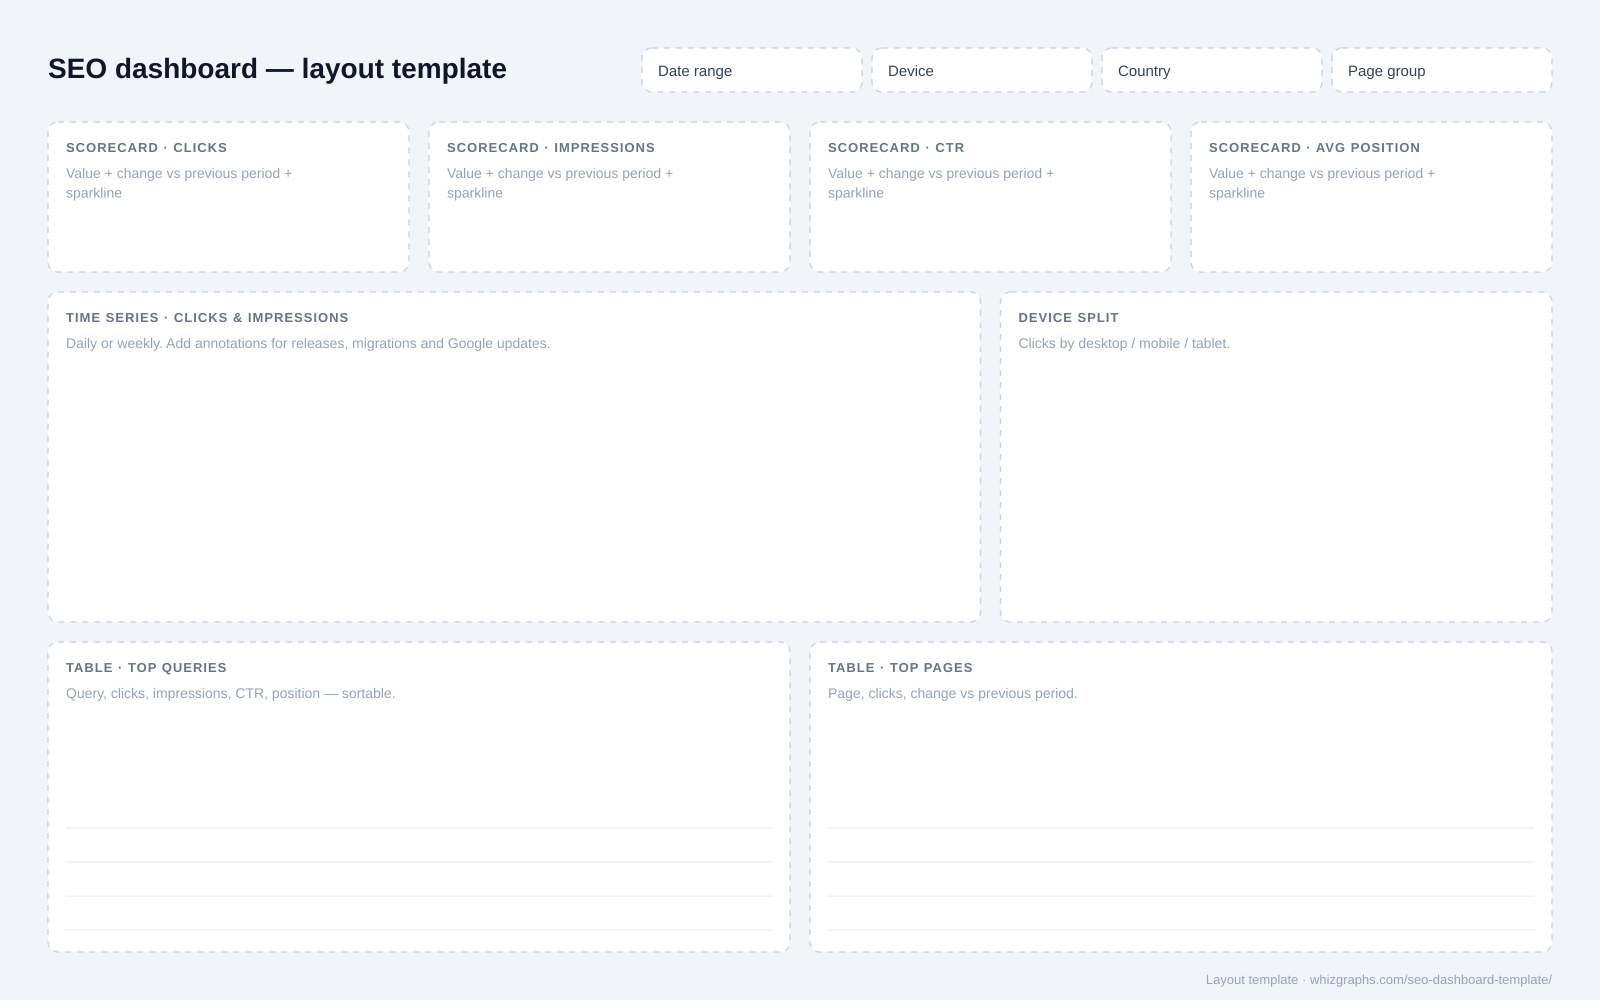
| Widget | Metrics / dimensions | Chart | Why it’s there |
|---|---|---|---|
| Filter bar | Date range with comparison, device, country, page group | Controls | One dashboard can answer many questions without a new report. |
| Scorecards ×4 | Clicks, impressions, CTR, average position | Scorecard with change and sparkline | The four Search Console totals at a glance, each against the previous period. |
| Trend | Clicks and impressions by day or week | Time series | Shows direction — and exactly when a change started. |
| Device split | Clicks by desktop, mobile, tablet | Donut or bar | Catches problems that only affect one device. |
| Top queries | Query, clicks, impressions, CTR, position | Sortable table | Where demand comes from, and which queries are under-clicked. |
| Top pages | Page, clicks, previous clicks, change | Table with change column | Which URLs are gaining or losing, so you know where to look. |
How to build this SEO dashboard in Looker Studio
The same order works in any BI tool; only the menu names change.
- 1
Connect Search Console
Create a report and add the Search Console connector as a data source. Choose your property; use the URL-level table when you need page-level data. - 2
Add the date control with comparison
A date-range control set to the last 28 days, and turn on the comparison to the previous period for every scorecard. - 3
Add four scorecards
Clicks, impressions, CTR and average position. Make sure position shows a fall as good — lower is better. - 4
Add the trend and device split
A time series for clicks and impressions by date; a pie or bar chart of clicks by device. - 5
Add the two tables
Queries with clicks, impressions, CTR and position; landing pages with clicks and their change. Sort both by clicks. - 6
Add filters and share view-only
Device, country and a page-group filter (e.g. URL contains /blog/). Share with the team as viewers so nobody breaks the layout.
An SEO dashboard is not an SEO report
You need both. The dashboard is for the person doing the work; the report is for the person who needs the conclusion. Most reporting pain comes from sending one when the reader needed the other.
| Dashboard | Report | |
|---|---|---|
| Who opens it? | The person doing the SEO work | The person paying for it or managing it |
| How often? | Daily or weekly, whenever needed | On a schedule — monthly or quarterly |
| What does it do? | Shows everything; you find the story | Tells one story; leaves out the rest |
| Does it update itself? | Yes, when connected to data | No, it’s written each period |
Turning dashboard findings into something you send? Use the SEO report template, or put one finding in an SEO infographic.
Frequently asked questions
Filters for date, device, country and page group; four scorecards for clicks, impressions, CTR and average position with their change; a clicks and impressions trend; a device split; and sortable tables of top queries and top pages. Those six widget groups cover most day-to-day monitoring from Search Console data.
Yes. Looker Studio has a built-in Search Console connector. Add it as a data source, then recreate each widget from the spec: scorecards for the four metrics, a time-series chart, a pie or bar chart by device, and tables by query and by page, with a date-range control and filter controls on top.
Yes, with a bit more manual work. Export the Performance report tabs from Search Console to Google Sheets, then build the scorecards with simple formulas and the trend and device charts with Sheets’ chart tool. It won’t refresh on its own, so it suits a weekly check rather than daily monitoring.
Usually not as the main report. Dashboards make the reader find the story. Send a one-page report with the headline and the numbers that matter, and link the dashboard for anyone who wants to explore.
Four full weeks contain the same number of each weekday, so weekend dips don’t distort the comparison with the previous 28 days. Use calendar months for monthly reports and 28-day windows for monitoring.