GSC infographic report: from Search Console export to one clear image
Google Search Console has everything you need for an SEO report — buried in a chart and five tabs of tables. This guide shows which part of the Performance report feeds which infographic, how to export it, and the data quirks to know before you put a number in front of anyone.
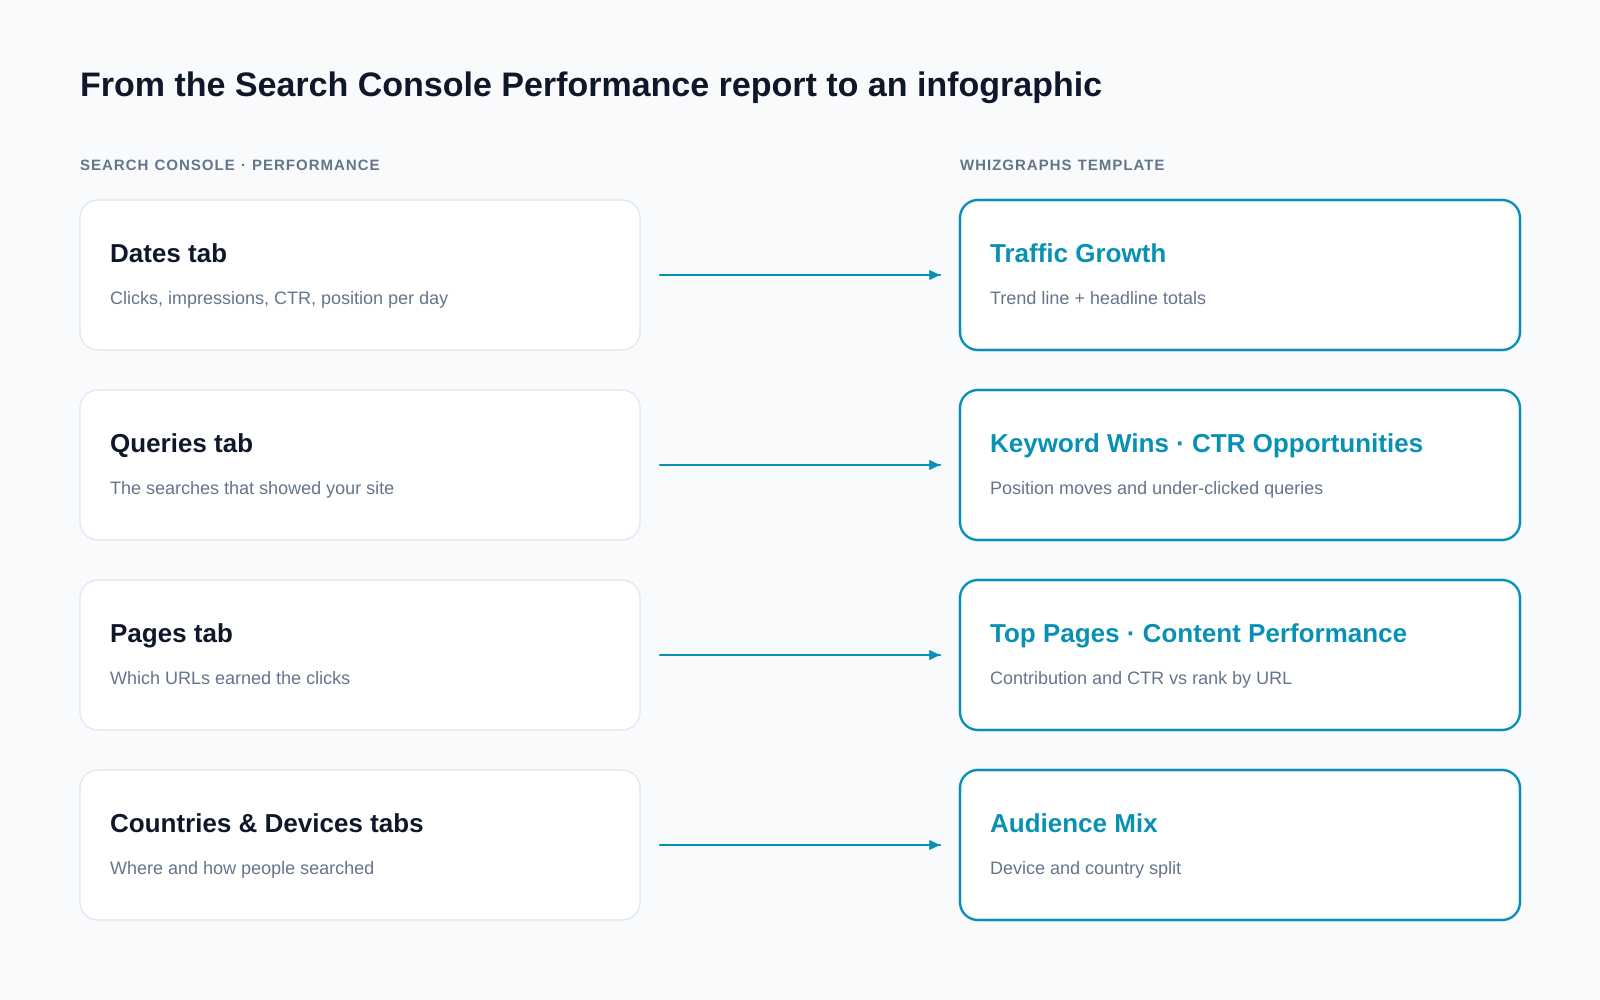
Which Performance report tab feeds which infographic
Every WhizGraphs template reads from one tab. Export the tab, get the visual.
| Tab | What it gives you | Infographic it feeds |
|---|---|---|
| Dates | Clicks, impressions, CTR and position for every day in the range | Traffic Growth, SEO Health Snapshot |
| Queries | Every query that showed your site, with its four metrics | Keyword Wins, CTR Opportunities |
| Pages | Every URL that appeared, with its four metrics | Top Pages, Content Performance |
| Countries | Metrics by searcher country | Audience Mix |
| Devices | Metrics by desktop, mobile, tablet | Audience Mix |
What Search Console actually counts
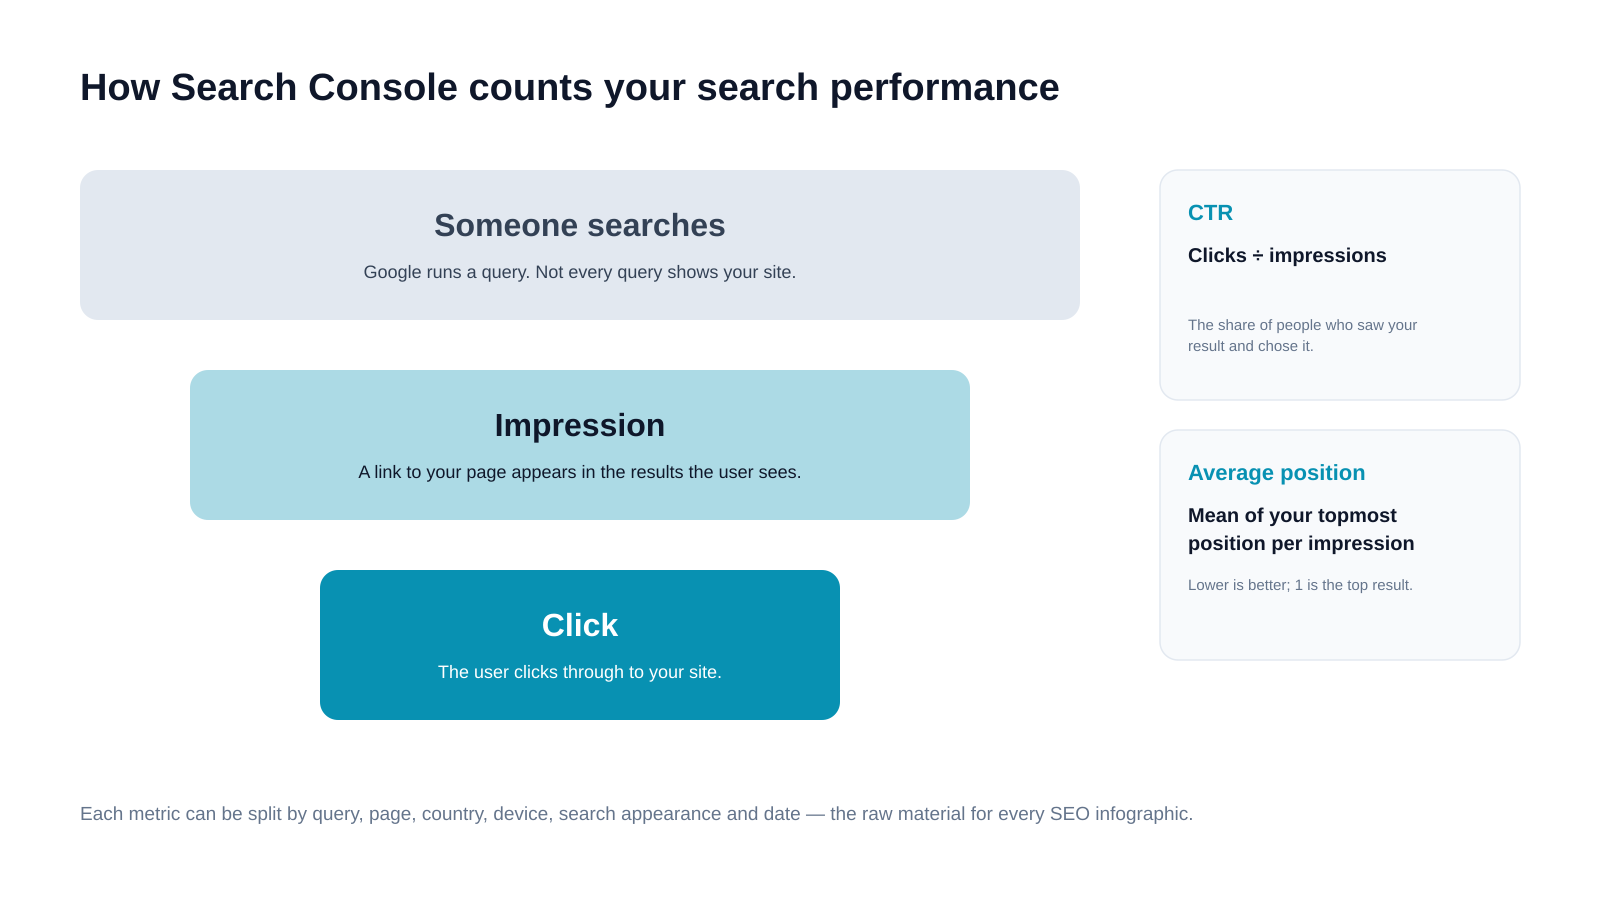
Every GSC infographic is built from four numbers. Get the definitions right and the rest of the report follows.
Clicks
Times someone clicked through to your site from Google Search results.
The demand number — what most stakeholders care about. Use it as the headline metric.
In the infographic: Trend line in Traffic Growth; bars in Top Pages.
Impressions
Times a link to your site appeared in results a user saw, clicked or not.
Visibility. Impressions often rise before clicks do — the earliest sign new content is surfacing.
In the infographic: Second tile in Traffic Growth; the denominator behind every CTR.
CTR
Clicks ÷ impressions.
Packaging. A page that ranks well with a low CTR usually needs a better title or description, not a higher rank.
In the infographic: Vertical axis in Content Performance; the red column in CTR Opportunities.
Average position
The average of your topmost position across impressions. Lower is better.
Where you sit. Report movement on the queries that matter, not just the sitewide average.
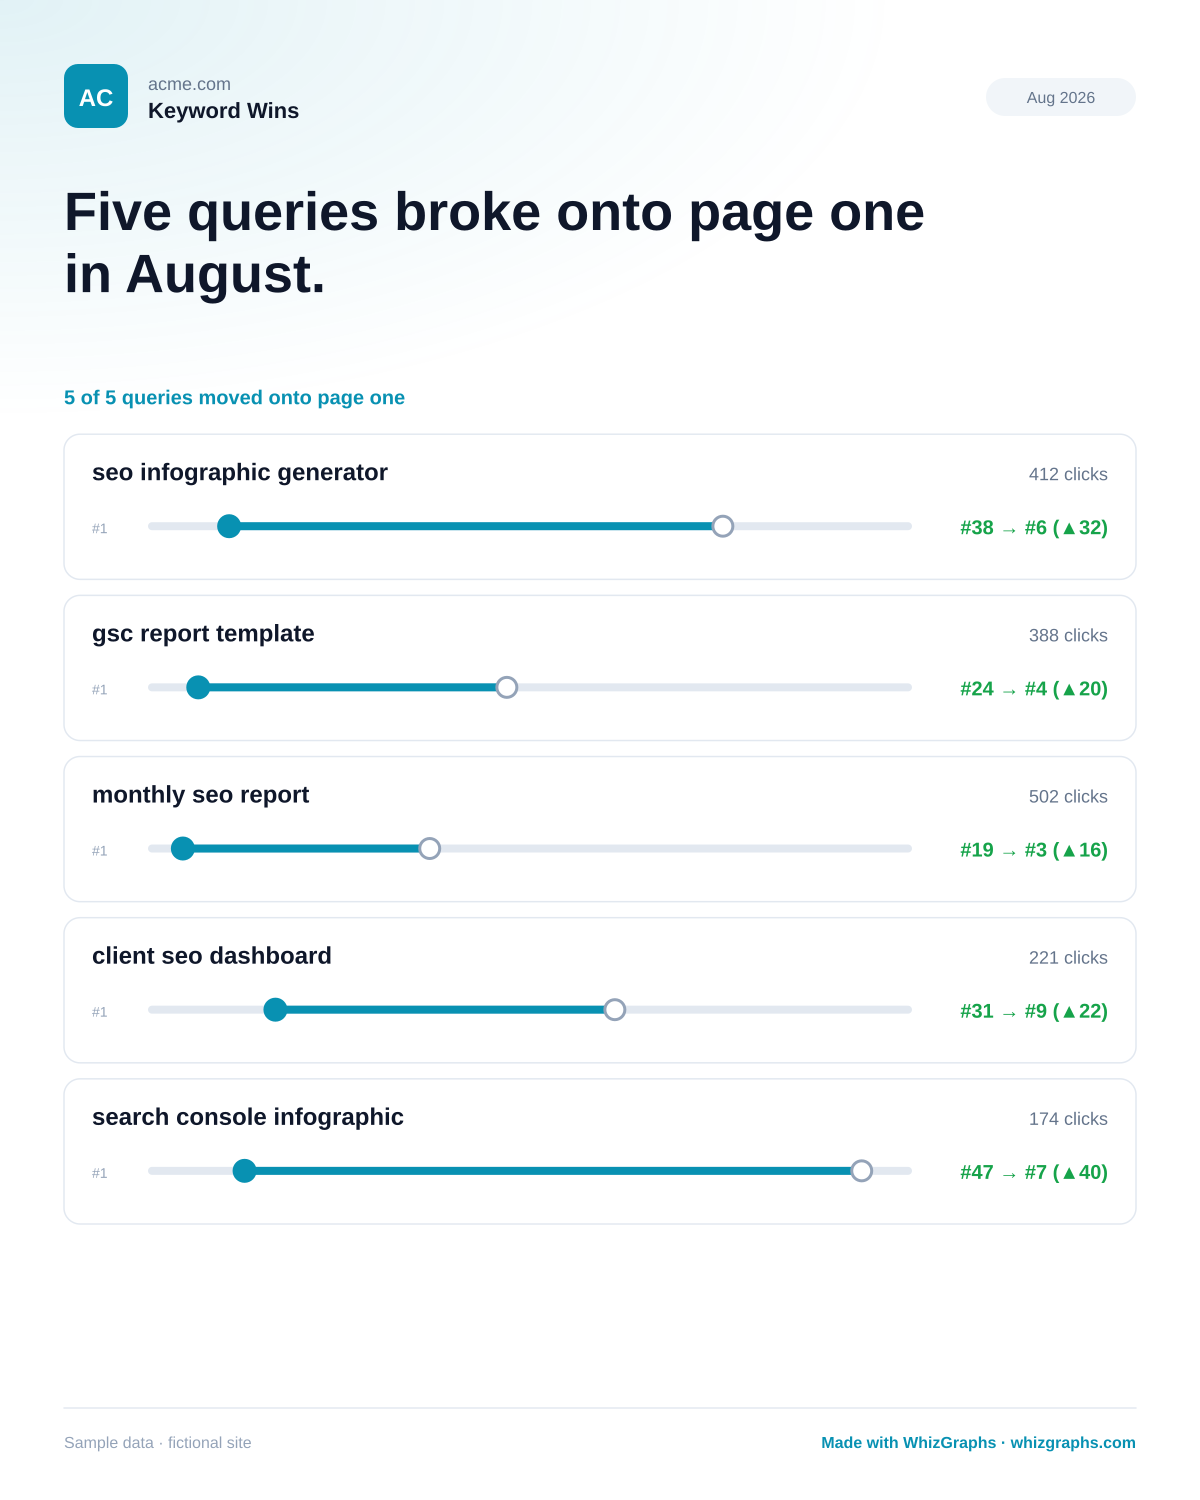
In the infographic: Before → after tracks in Keyword Wins; the horizontal axis in Content Performance.
How to turn a Search Console export into an infographic report
- 1
Open Performance → Search results
Check that Web is the search type and the right property is selected. - 2
Set the date range and comparison
Last month vs the month before, or vs the same month last year. The comparison is where the story is. - 3
Export
Use Export → Google Sheets, Excel or CSV. The file contains a separate sheet for each tab — Dates, Queries, Pages, Countries, Devices — for the range you set. - 4
Open the sheet for your question
Use the map above: Dates for trends, Queries for movement, Pages for concentration. - 5
Compute changes and pick the finding
Percent change for clicks and impressions, percentage points for CTR, places for position. Then write one sentence. - 6
Lay it out
Use a WhizGraphs template, or for a fuller document the one-page SEO report template.
Five Search Console data quirks to know
None of these are bugs — but each one has embarrassed someone in a client meeting.
Search Console omits some rare queries to protect user privacy, so the Queries tab adds up to less than the Pages tab. Report clicks from the chart totals, and use the Queries tab for movement.
Exports from the Performance report include up to 1,000 rows per table. For long-tail analysis beyond that, use the Search Console API or the Looker Studio connector.
Performance data only goes back 16 months. Keep your own monthly export if you want longer year-over-year comparisons later.
The newest data arrives with a short delay. Leave the last couple of days out of a report, or pull it a few days after the period ends.
New impressions on deep, long-tail queries pull the average down even while your important rankings improve. Pair it with the query list.
Note: graphics on this site are generated from sample Search Console-style data for fictional sites. Live Search Console sync in the WhizGraphs app is rolling out gradually.
Frequently asked questions
A Google Search Console report rendered as a single shareable image instead of tables. It takes the Performance report’s clicks, impressions, CTR and average position — by date, query or page — and lays them out so anyone can read the result without opening Search Console.
Open Performance → Search results, set the date range (and a comparison if you want one), then use the Export button to download a CSV or Excel file or send it to Google Sheets. The export contains a separate sheet for each tab — Queries, Pages, Countries, Devices, Dates — for the range you selected.
Dates for trends and totals (Traffic Growth, SEO Health Snapshot); Queries for ranking movement and under-clicked searches (Keyword Wins, CTR Opportunities); Pages for which URLs carry the site (Top Pages, Content Performance); Countries and Devices for Audience Mix.
Search Console leaves out some infrequent queries for privacy reasons, so the Queries tab sums to less than the site total. Use the chart totals for headline numbers and the Queries tab for which searches moved.
Not today. The app runs on realistic mock Search Console data so you can build and preview any template now. Live Search Console sync is rolling out gradually; until then you can follow the export steps on this page and build the same visuals by hand.