Free SEO report template
A one-page SEO report your client or manager will actually read: a headline, four Search Console metrics with their change, a trend, top pages, keyword wins, and what you did and will do next. Download it as a printable PDF, a ready-to-fill spreadsheet, or images.
Free, no sign-up.
- SEO report template (PDF)2 pages: blank template + filled example. Letter size, print-ready.PDF
- Report data sheet (CSV)Opens in Google Sheets or Excel. Change formulas pre-filled.CSV
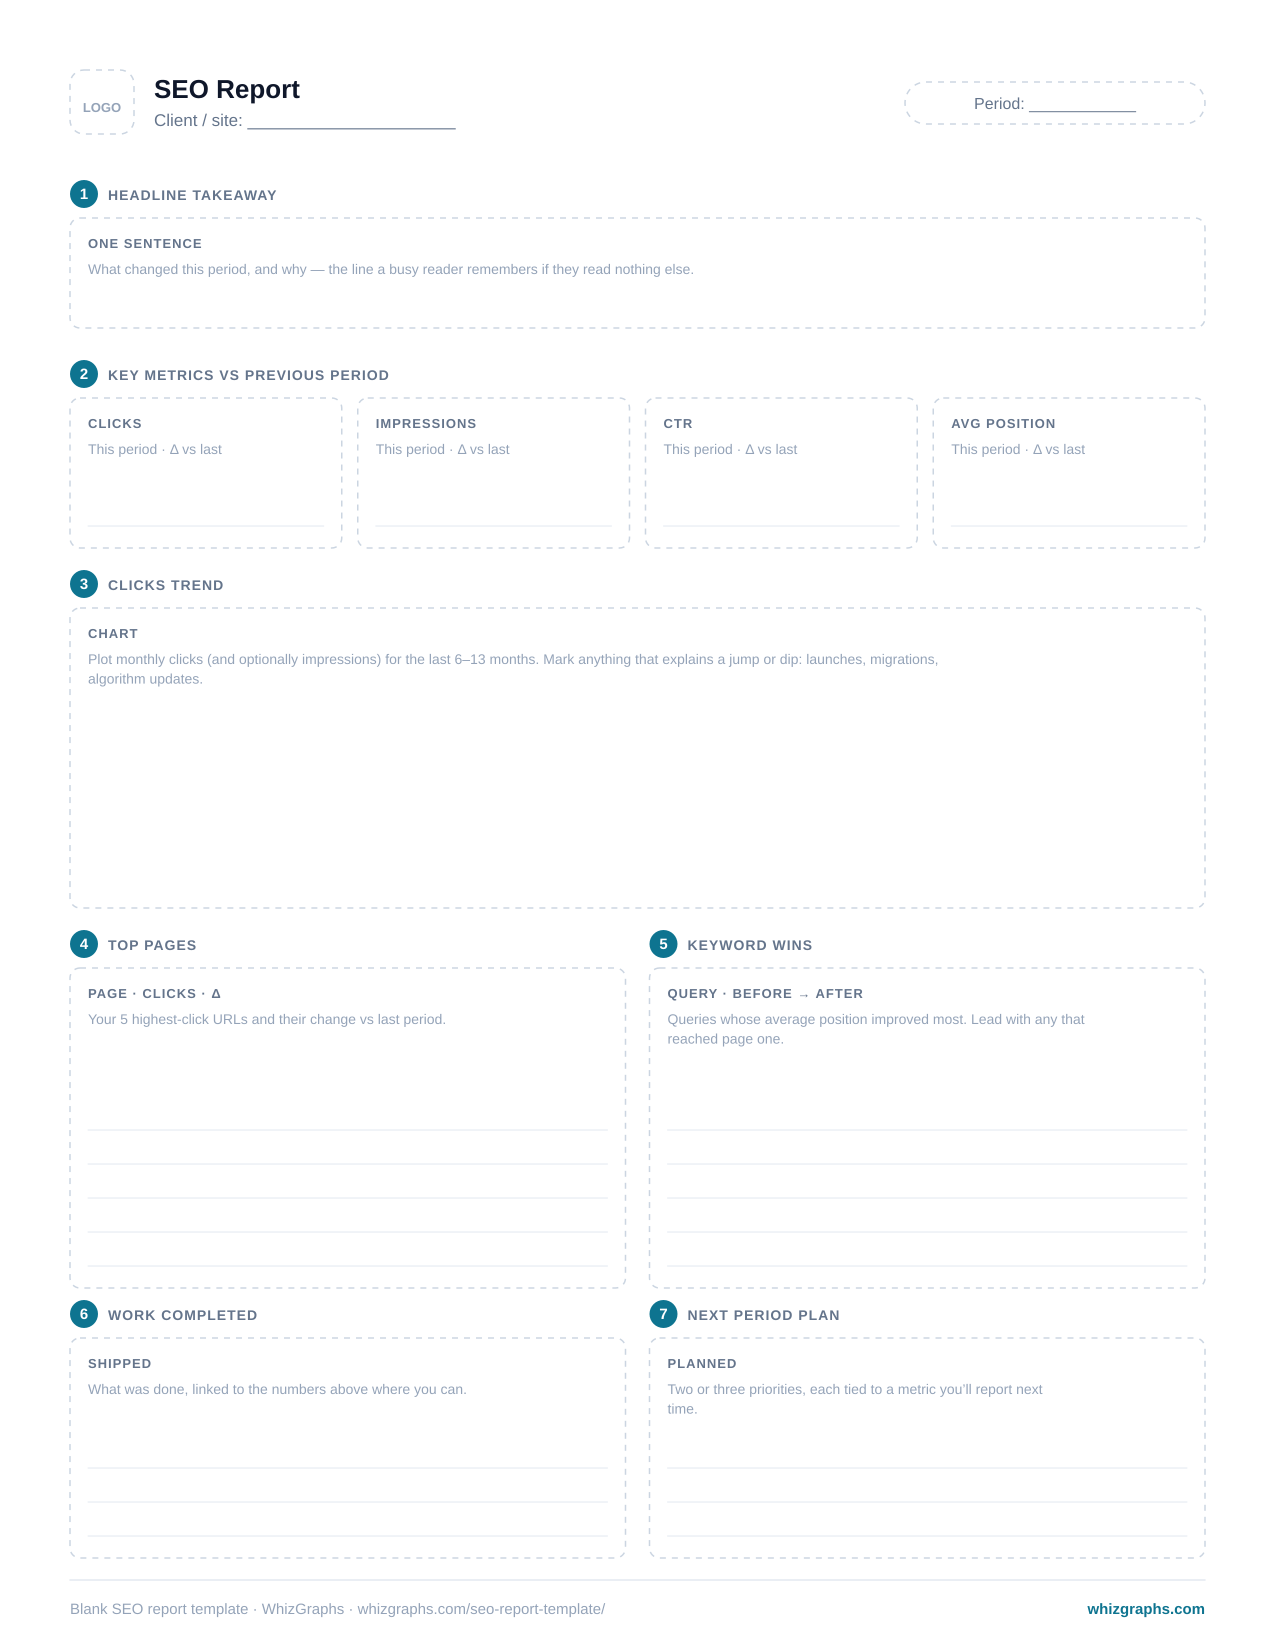
- Blank template (PNG)1275×1650px — drop into Slides, Canva or Figma.PNG
- Filled example (PNG)Sample data for a fictional store.PNG
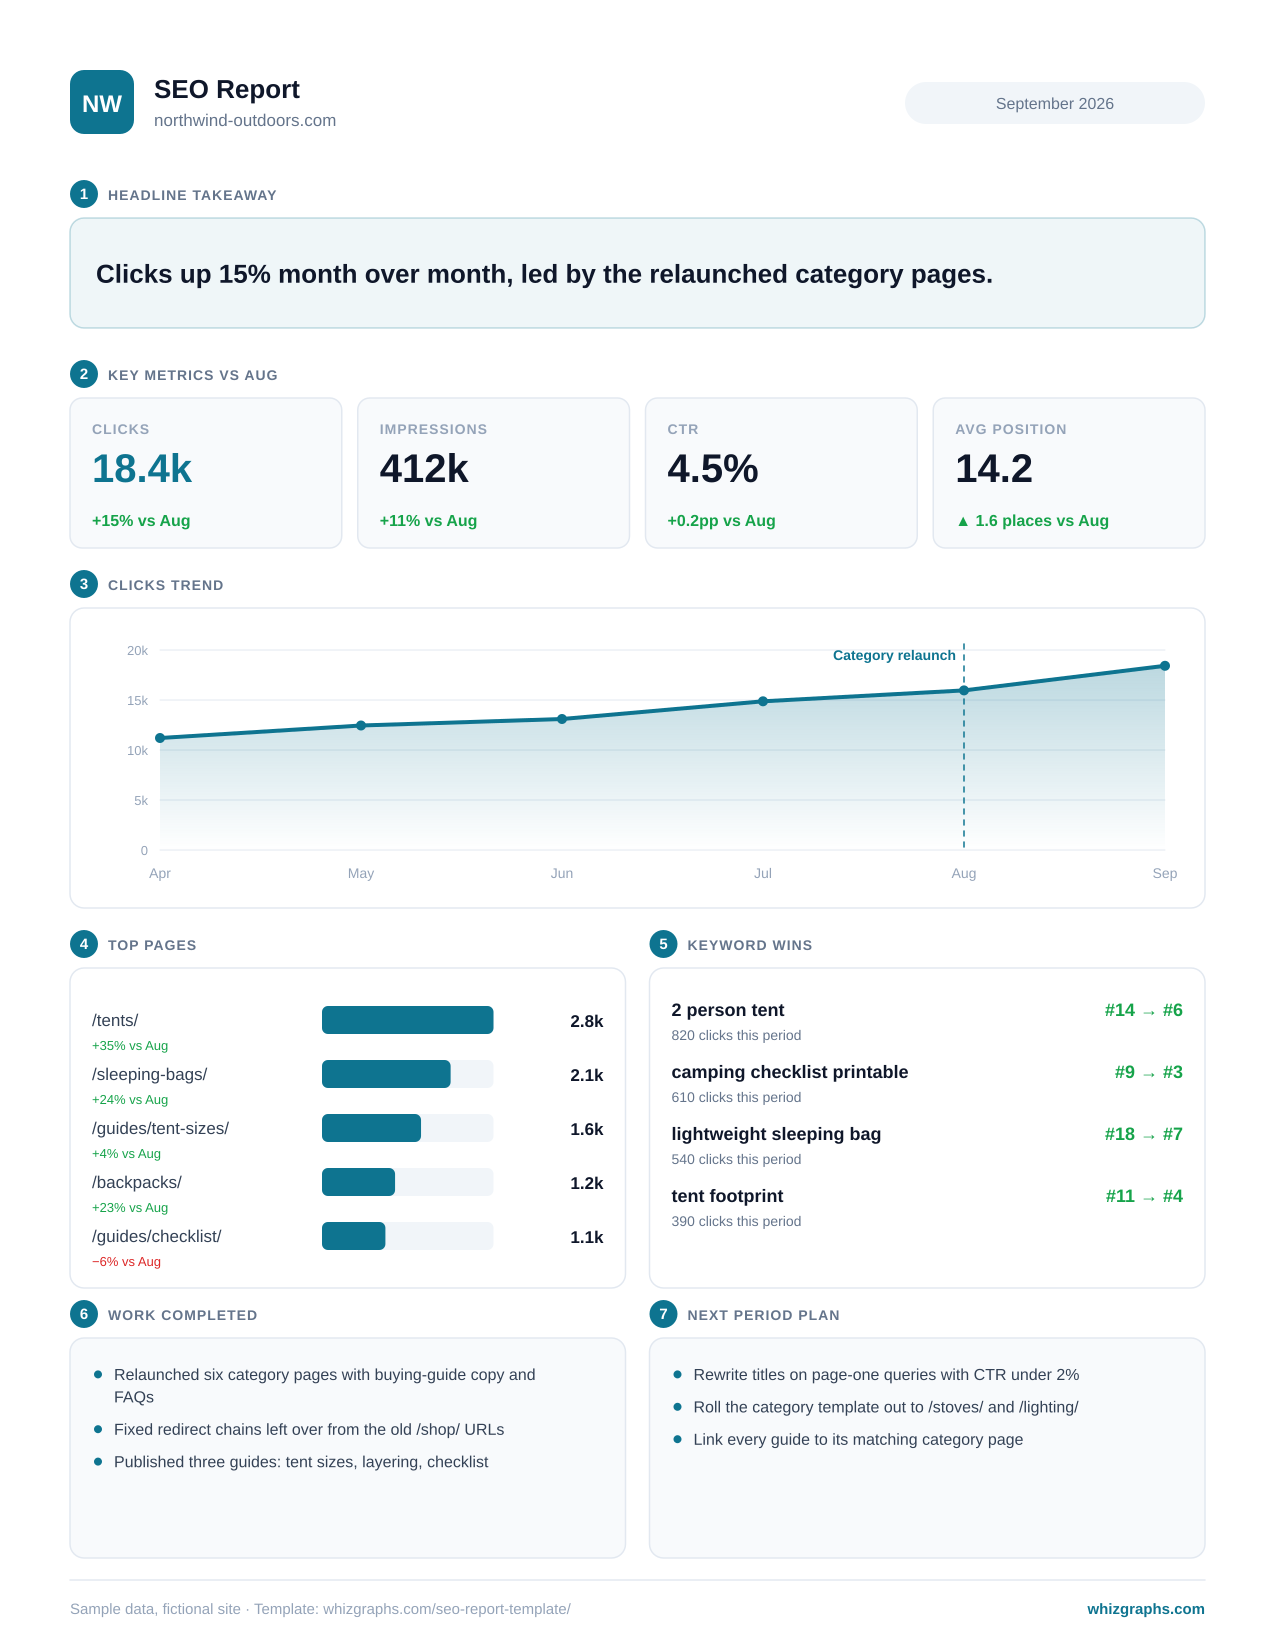
Seven sections, and exactly what goes in each
Each section answers one question your reader has. Here’s what to put there, where to get it, and the trap to avoid.
| Section | What goes there | Where to get it | Common trap |
|---|---|---|---|
| 1. Headline takeaway | One sentence: what changed this period and why. | Your read of sections 2–5. Write it last. | Describing the report (“Here is September’s SEO report”) instead of the finding. |
| 2. Key metrics | Clicks, impressions, CTR and average position, each with its change versus the previous period. | Search Console → Performance → Search results, with “Compare” set to the previous period. | Reporting CTR change as a percent (“+4%”) rather than percentage points (“+0.2pp”). |
| 3. Clicks trend | Six to thirteen months of clicks, with launches, migrations or algorithm updates marked. | Performance report → Dates tab (export, then sum by month). | A one-month window that makes normal seasonality look like a crisis. |
| 4. Top pages | The five URLs with the most clicks, and each one’s change. | Performance report → Pages tab, sorted by clicks. | Listing pages without the change — the reader can’t tell rising from falling. |
| 5. Keyword wins | The queries whose average position improved most, before → after. Lead with any that reached page one. | Performance report → Queries tab, comparing positions across the two periods. | Celebrating a jump from position 60 to 30 — real, but no traffic yet. Say so. |
| 6. Work completed | Three or so things that shipped, tied to the numbers above where possible. | Your task tracker or changelog. | A task list with no link to outcomes; the reader can’t see what the work did. |
| 7. Next period plan | Two or three priorities, each tied to a metric you’ll report next time. | The gaps the report itself exposed: under-clicked pages, falling URLs, near-page-one queries. | Ten priorities. If everything is next, nothing is. |
Start from the blank, check against the example
The blank version prompts you section by section; the filled one shows what a finished report looks like. Both are in the PDF.
How to fill in the SEO report template
- 1
Set the period and the comparison
In Search Console’s Performance report, pick the date range and use Compare → previous period (or the same period last year). - 2
Fill the four key metrics
Copy clicks, impressions, CTR and average position for both periods into the sheet. The CSV computes the changes. - 3
Export the Dates, Pages and Queries tabs
Dates gives the trend; Pages gives the top five URLs; Queries gives the movers. - 4
Write work completed and next steps
Tie each item to a number on the page where you can — that’s what makes the work visible. - 5
Write the headline last
Now you know the story. One sentence: what changed, and why. - 6
Send it as one page
PDF or image, in the email body if you can. Want the top of it as a shareable graphic? Use an SEO infographic.
Writing the headline: before and after
The headline is the only part some readers will see. A label wastes it; a finding uses it.
Which SEO reporting format to use when
| One-page report | Slide deck | Dashboard | |
|---|---|---|---|
| Best for | Regular updates to clients and managers | A formal quarterly or annual review | Your own daily or weekly monitoring |
| Reader effort | Read in under a minute | Needs a meeting to walk through | Needs the reader to explore |
| Tells a story? | Yes — headline first | Yes, slide by slide | No — it shows, you interpret |
| Updates itself? | No, written each period | No | Yes, if connected to data |
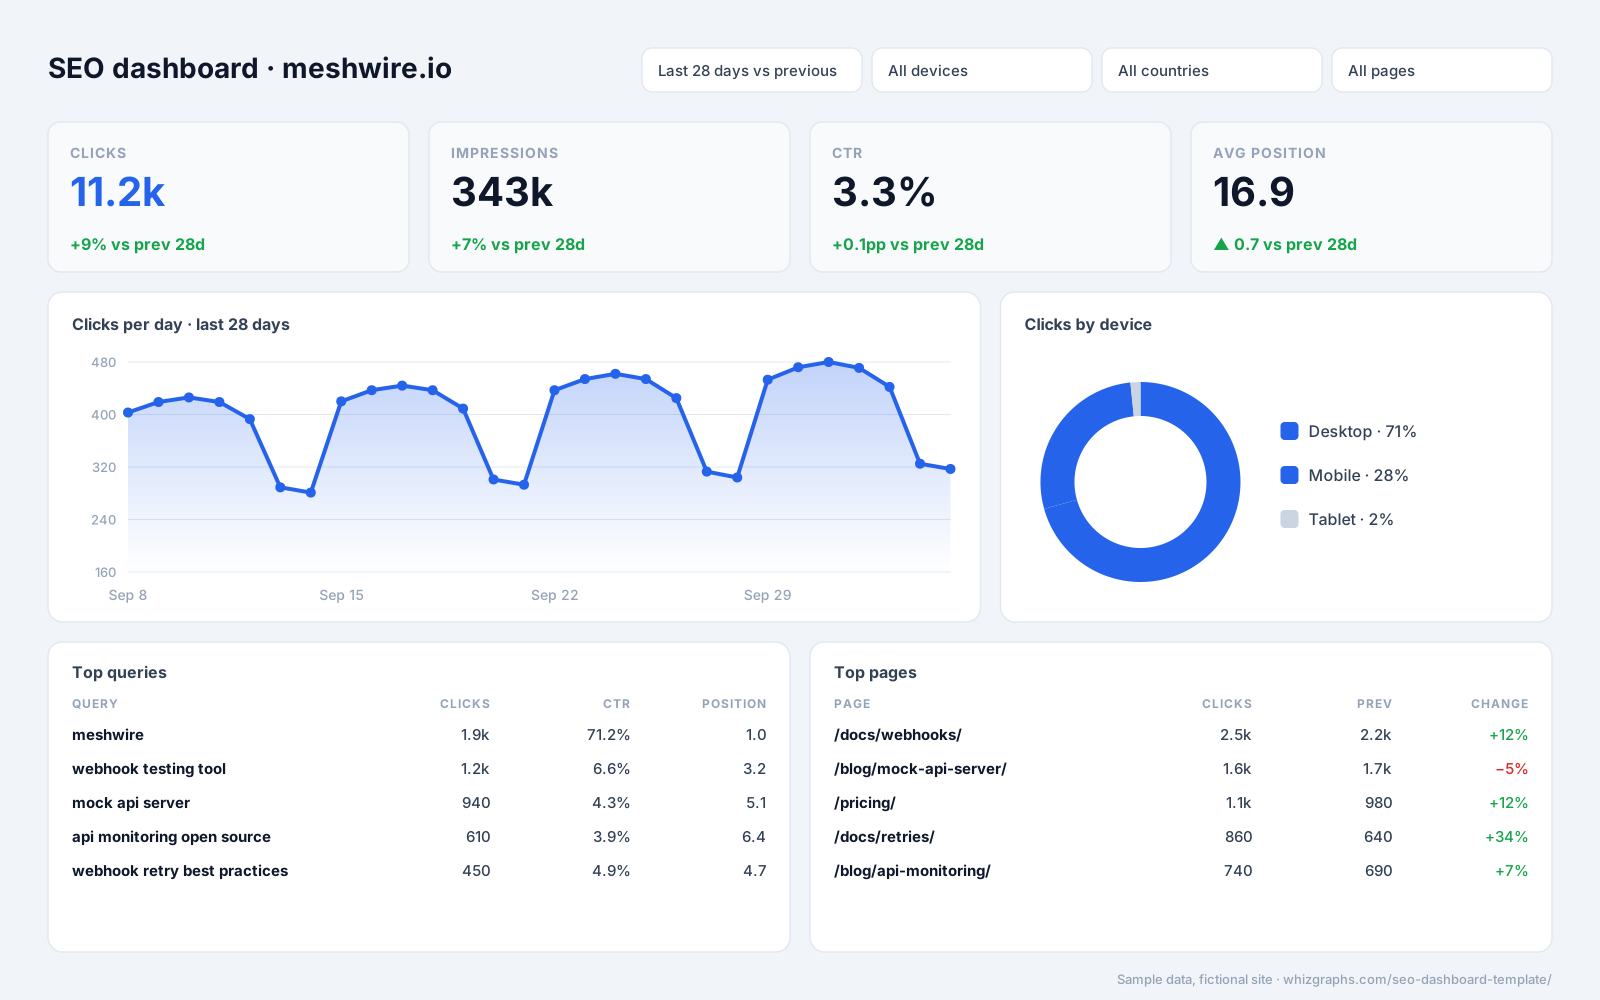
| Start from | This template | This template, one section per slide | The SEO dashboard template |
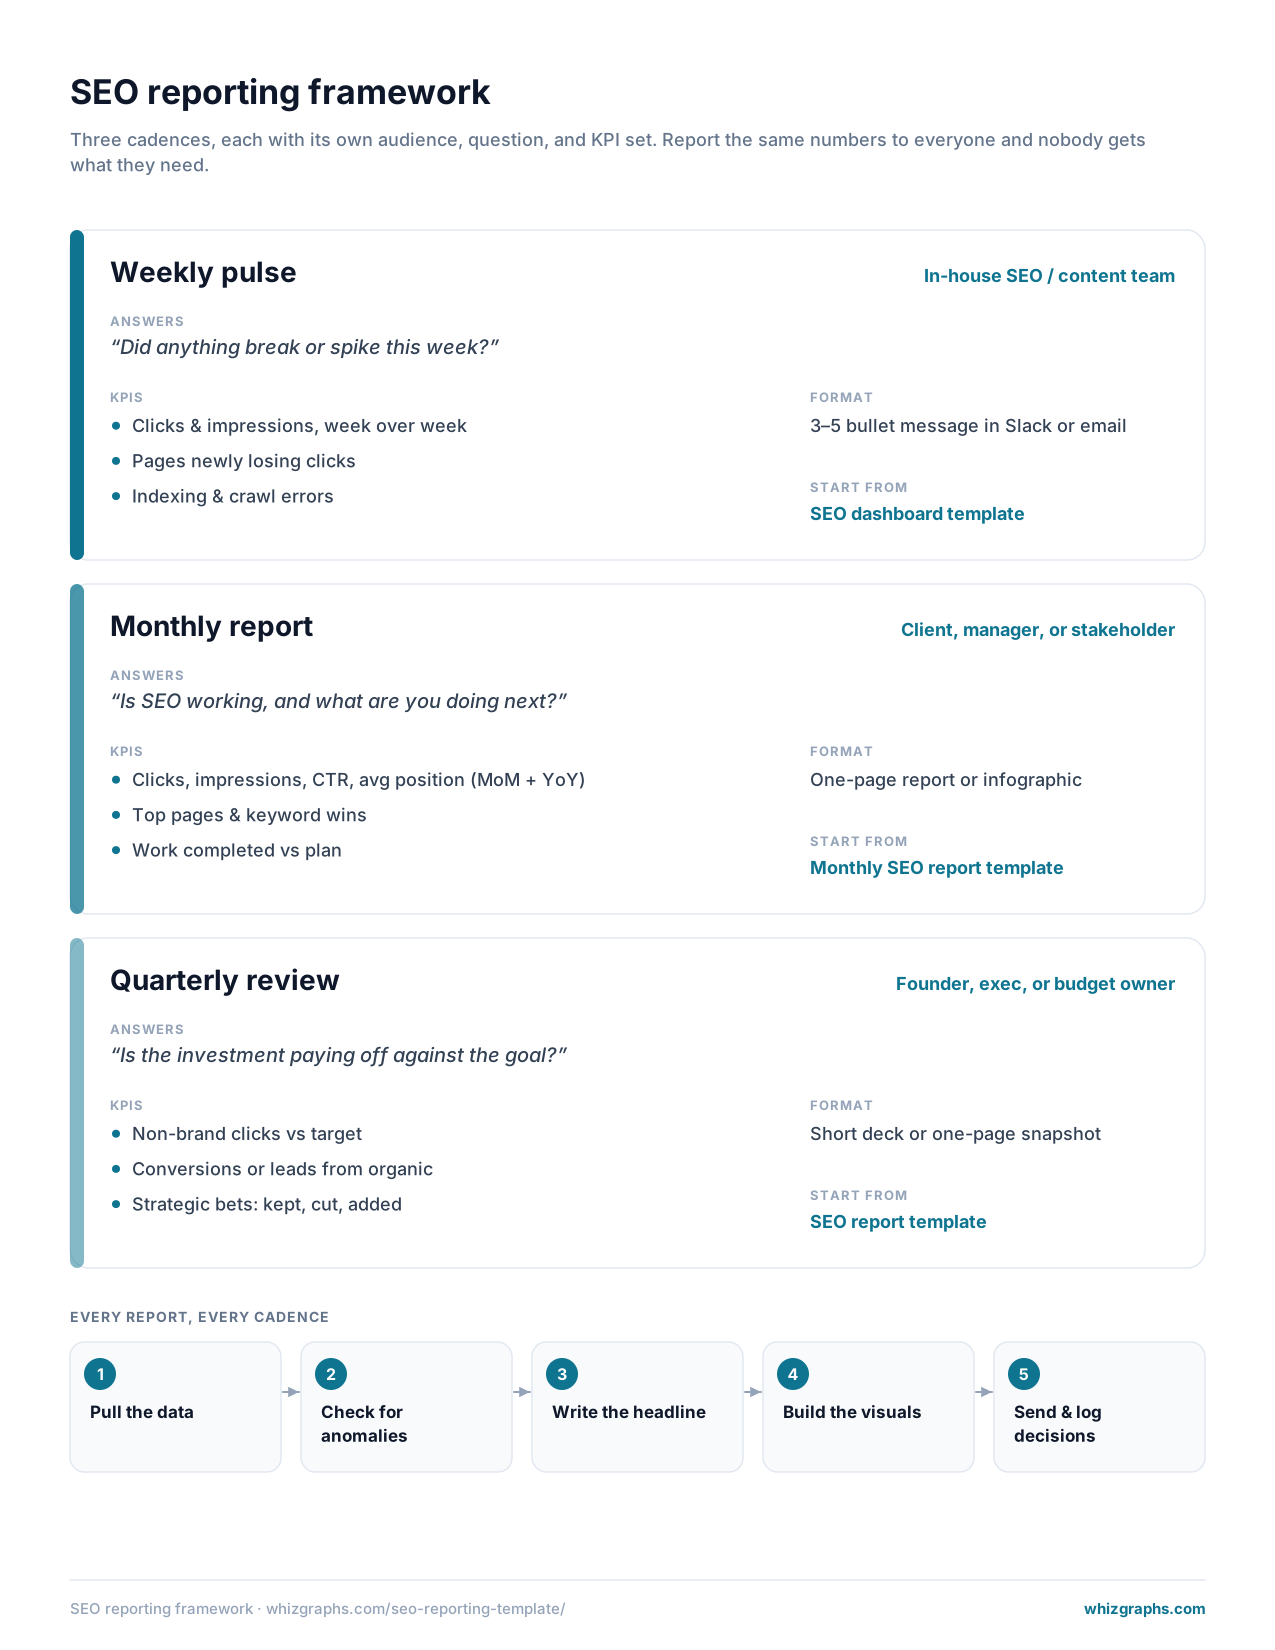
Need a different shape of report?
Frequently asked questions
At minimum: a one-sentence headline, the four Search Console metrics (clicks, impressions, CTR, average position) with their change, a clicks trend, top pages, keyword movement, the work completed and the plan for next period. This template has exactly those seven sections on one page.
Yes. The PDF (blank and filled example), the CSV data sheet and the PNGs are free to download and use for clients or internal reporting. No sign-up.
In Google Sheets choose File → Import → Upload, select the CSV, and import it as a new spreadsheet. Fill in the “This period” and “Previous period” columns; the change formulas calculate automatically. Excel opens the file directly.
For a regular client or stakeholder update, one page. Put the detail — full query lists, technical audits — in an appendix or a dashboard link for anyone who wants to dig in. Most readers stop after the headline and the key metrics.
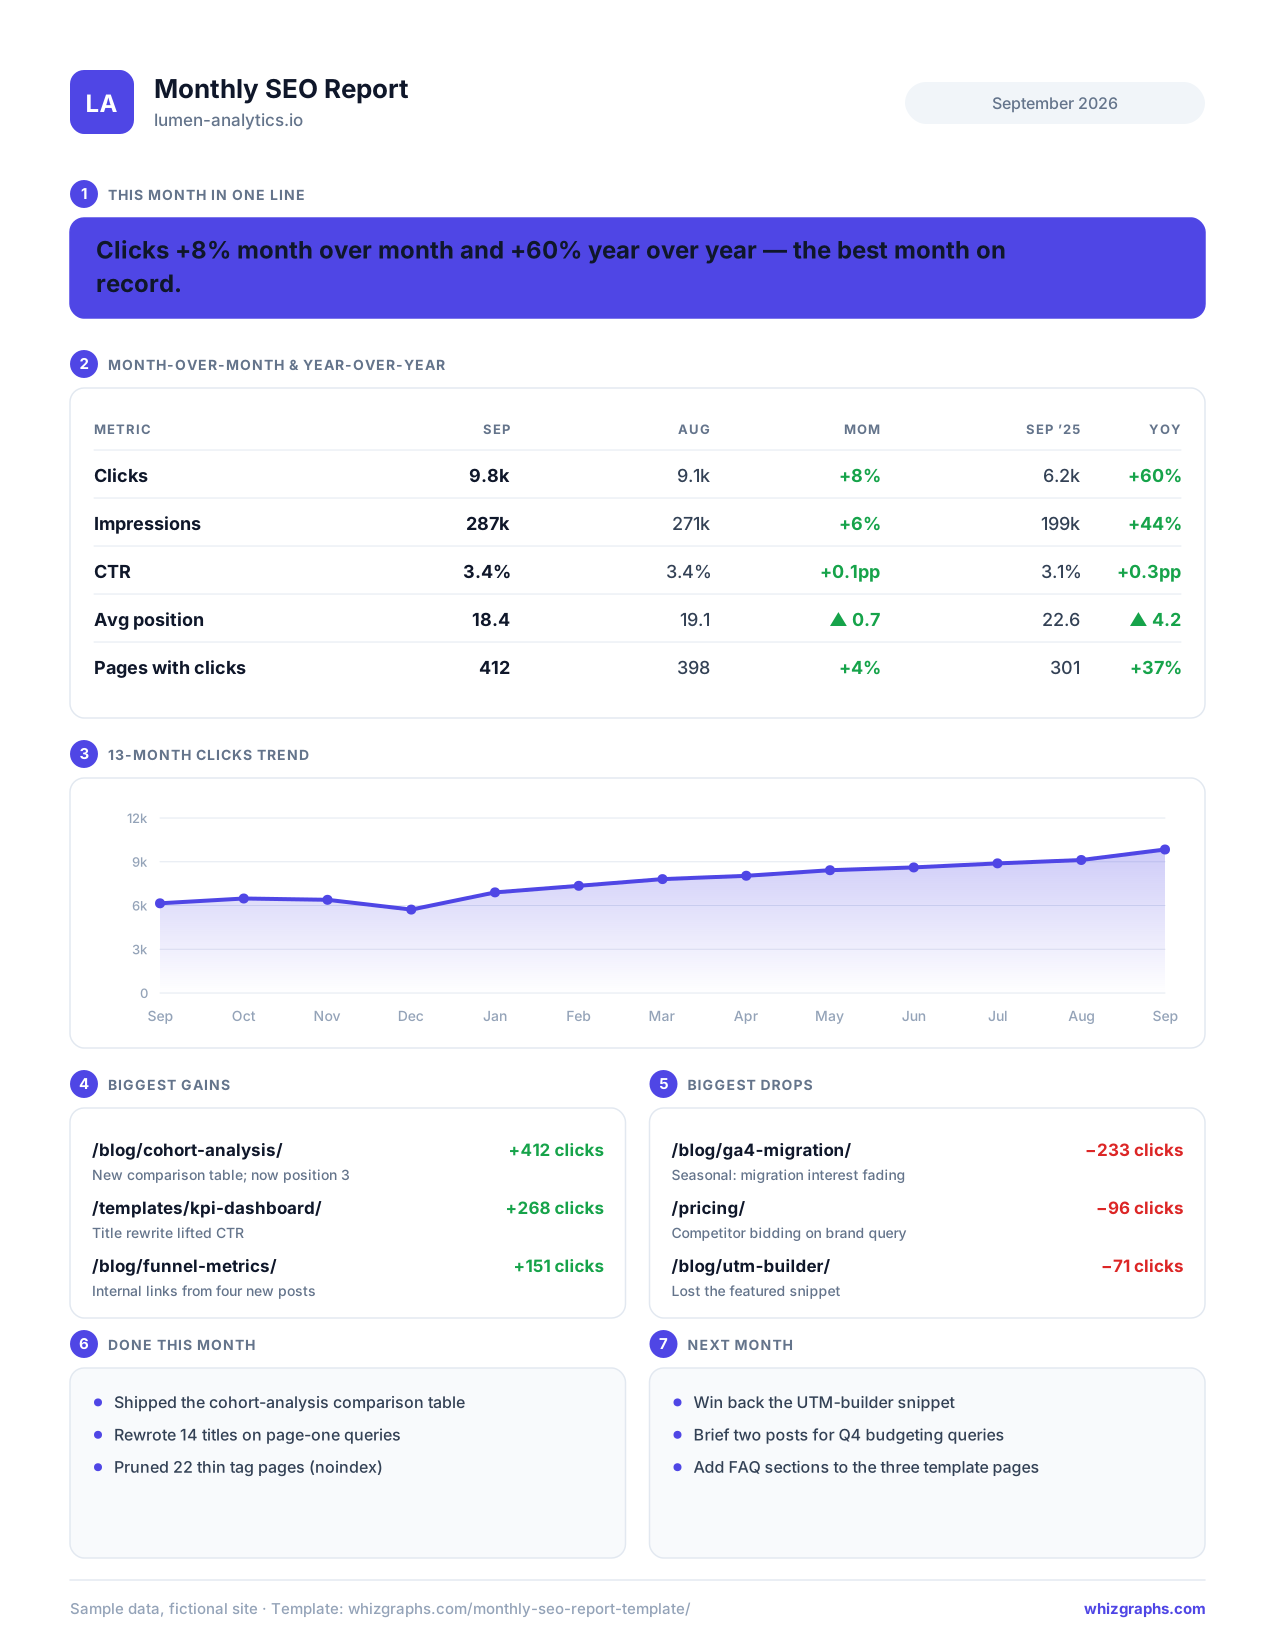
This one is period-agnostic and story-led: one comparison, a trend, wins and work. The monthly template adds a month-over-month and year-over-year table, a 13-month trend and page-level gains and drops, for when the report always runs on a calendar month.
Everything on the template comes from the Google Search Console Performance report, except the work completed and the plan, which come from you. If you also report conversions, add a row sourced from your analytics tool.