Monthly SEO report template
A one-page monthly report built around the two comparisons that matter every month: versus last month, and versus the same month last year. Includes a 13-month trend, the pages that gained and dropped, and a done / next list.
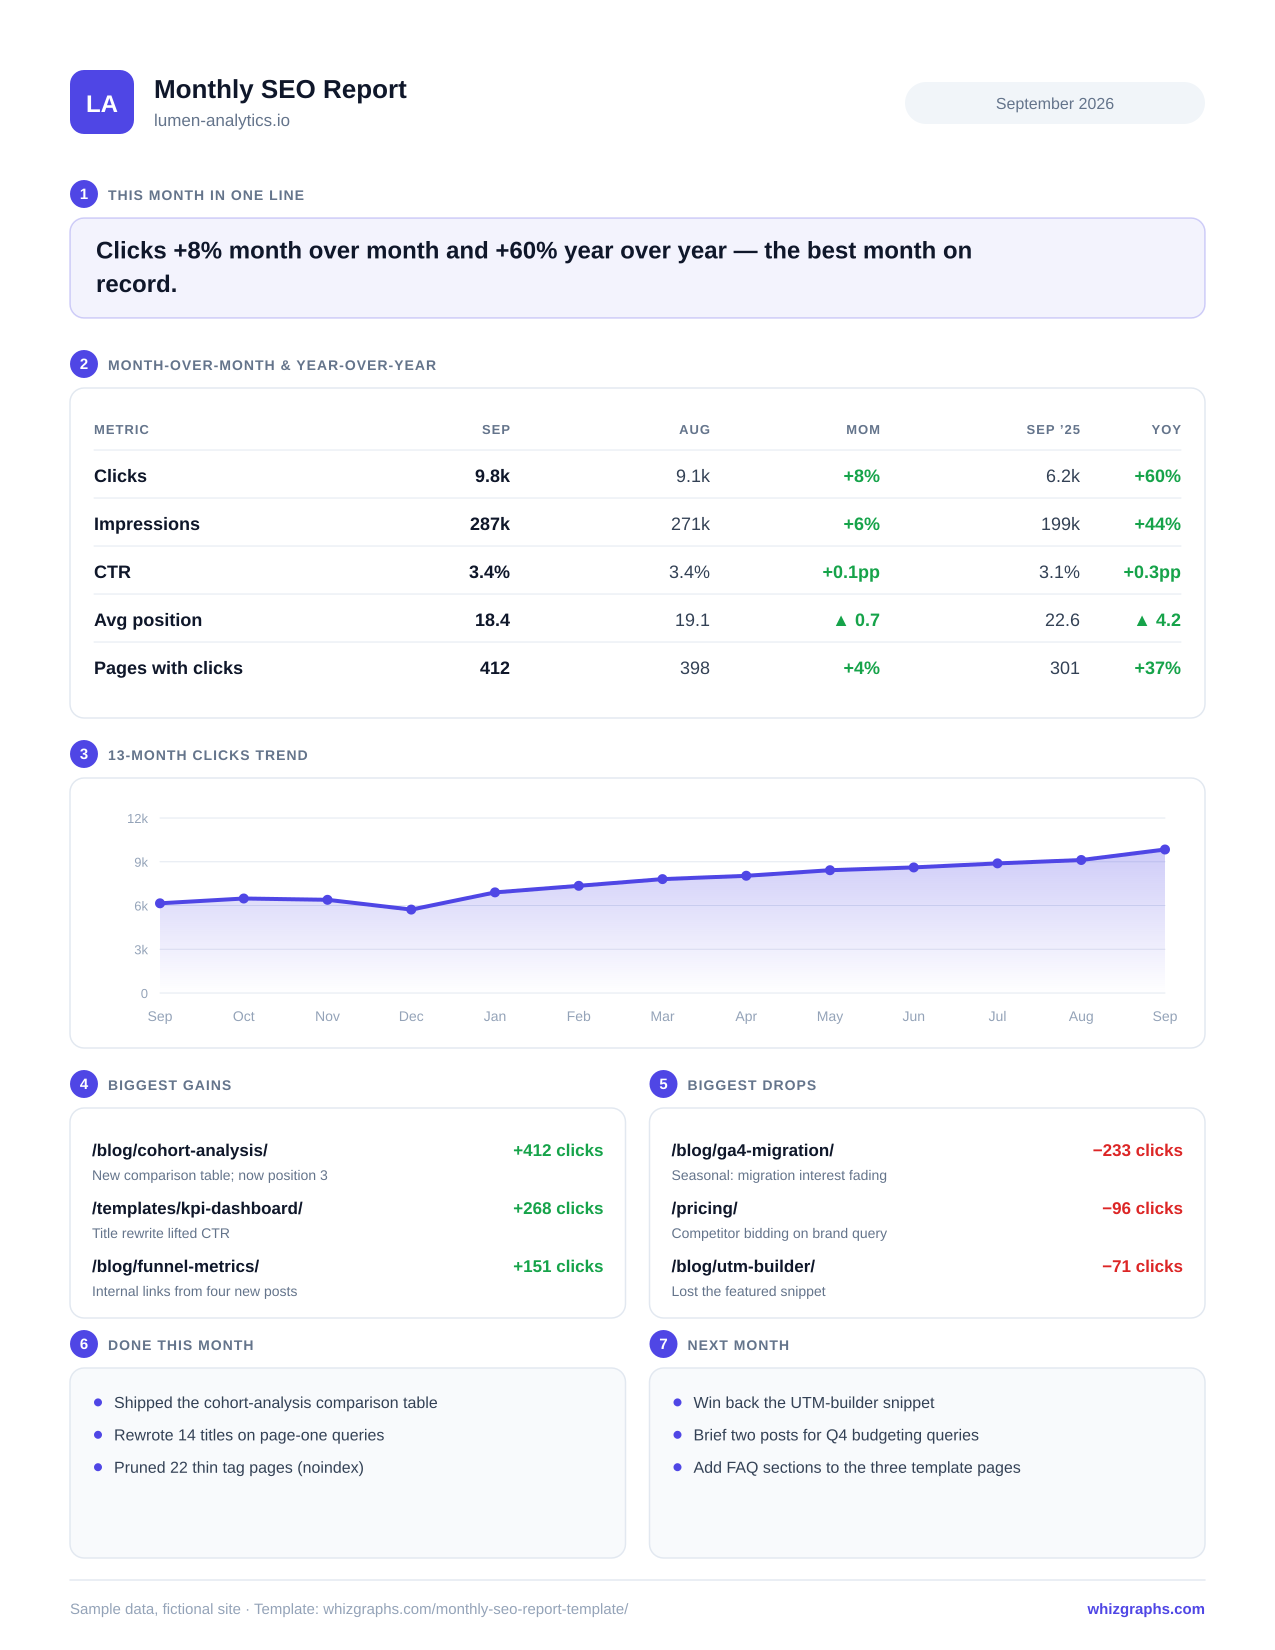
Every month, two comparisons and one long line
Month-over-month answers “are we moving?”. Year-over-year answers “is this actually better, or just the season?”. The 13-month trend puts this month next to the same month last year on a single line, so the reader can see both at once.
Most monthly reports show only the first comparison — which is why so many of them cause a panic every December.
| Metric | Formula | Example |
|---|---|---|
| Clicks, impressions, pages with clicks | (this month ÷ comparison month) − 1A percent change. | 9,840 vs 9,120 → +8% |
| CTR | this month’s CTR − comparison CTRPercentage points, not percent — CTR is already a percentage. | 3.43% vs 3.36% → +0.07pp |
| Average position | comparison position − this month’s positionLower is better, so a falling number is an improvement. Show it as places gained. | 19.1 → 18.4 → ▲ 0.7 |
Seven sections, top to bottom
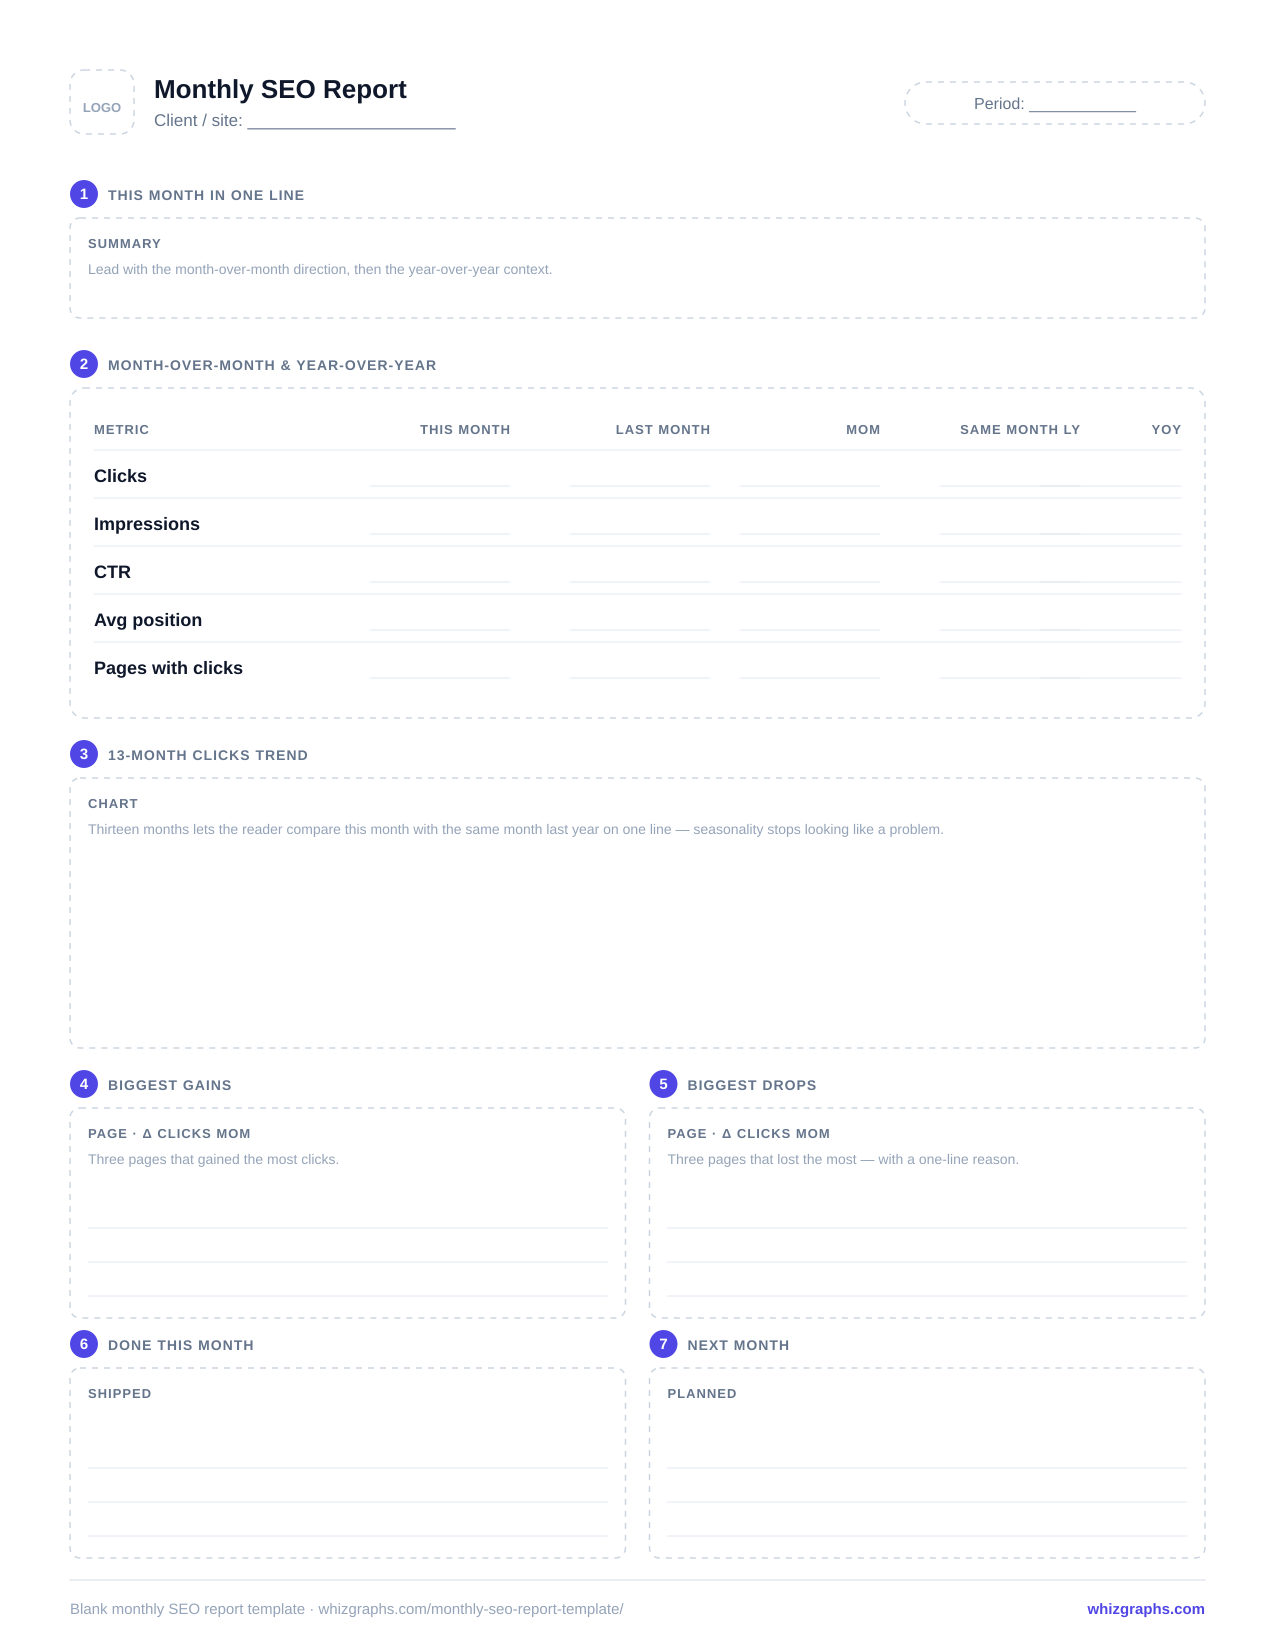
The blank version, with a prompt in every box. The filled example is above.
- 1This month in one line
Lead with the month-over-month direction, then the year-over-year context.
- 2MoM & YoY table
Five metrics across this month, last month, and the same month last year, with both changes.
- 313-month clicks trend
Thirteen points so this month and the same month last year sit on one line.
- 4Biggest gains
The three pages that gained the most clicks, each with a one-line reason.
- 5Biggest drops
The three that lost the most — with the reason, or “investigating”.
- 6Done this month
What shipped, ideally linked to a gain above.
- 7Next month
Two or three priorities, each tied to a number you’ll report next month.
How to produce the report each month
- 1
Wait a few days into the new month
Let Search Console finish processing the final days of the month you’re reporting on. - 2
Pull this month vs last month
Performance → Search results → Date → Compare → previous month. Copy the four totals into the sheet; add pages with clicks from the Pages tab. - 3
Pull this month vs the same month last year
Change the comparison and copy the totals into the year-over-year column. The CSV computes both changes. - 4
Find the gains and drops
On the Pages tab with the month-over-month comparison, sort by the click difference both ways. Note one reason per page. - 5
Update the 13-month line
Add the new month, drop the oldest. Keep any annotations for launches or updates. - 6
Write the one-liner, then send
Same day every month. Consistency is what turns a report into a habit for your reader.
Five monthly-report traps
February has up to three fewer days than March. When a month-over-month change is small, check the daily average before calling it a trend.
A December dip is often just December. That’s what the year-over-year column and the 13-month line are for.
Search Console data arrives with a short delay. Pull the report a few days into the new month so the final days of the old one are complete.
Before writing “traffic is down”, check the Pages tab. A single URL losing a featured snippet can account for most of a sitewide dip.
New long-tail impressions at position 40 drag the average down even as rankings improve. Read it alongside clicks and the keyword list.
Frequently asked questions
A one-line summary; clicks, impressions, CTR, average position and pages with clicks, each compared with last month and the same month last year; a 13-month clicks trend; the pages that gained and lost the most; and what was done this month and is planned for next. That is the layout of this template.
Because many sites are seasonal. Month-over-month tells you about momentum; year-over-year tells you whether this month is actually better than the equivalent month before. Showing both stops a normal seasonal dip from being read as a problem.
Early in the following month, once the final days of the reporting month have appeared in Search Console — a few days in is a safe rule. Pick a fixed day and stick to it so your reader expects it.
Yes. Leave the year-over-year column blank until you have a year of history, and plot however many months you have. Search Console keeps 16 months of performance data, so once you’re set up you’ll always have a full year to compare.
The SEO report template is period-agnostic and story-led. This monthly version adds the month-over-month and year-over-year table, the 13-month trend and page-level gains and drops — built for a report that always runs on the calendar.