SEO infographics

SEO infographics: turn search data into one clear image

An SEO infographic compresses a month of Search Console data — traffic, rankings, top pages — into a single graphic anyone can read in seconds. Below: five free templates, what makes one work, and how to publish infographics so they help your own SEO.

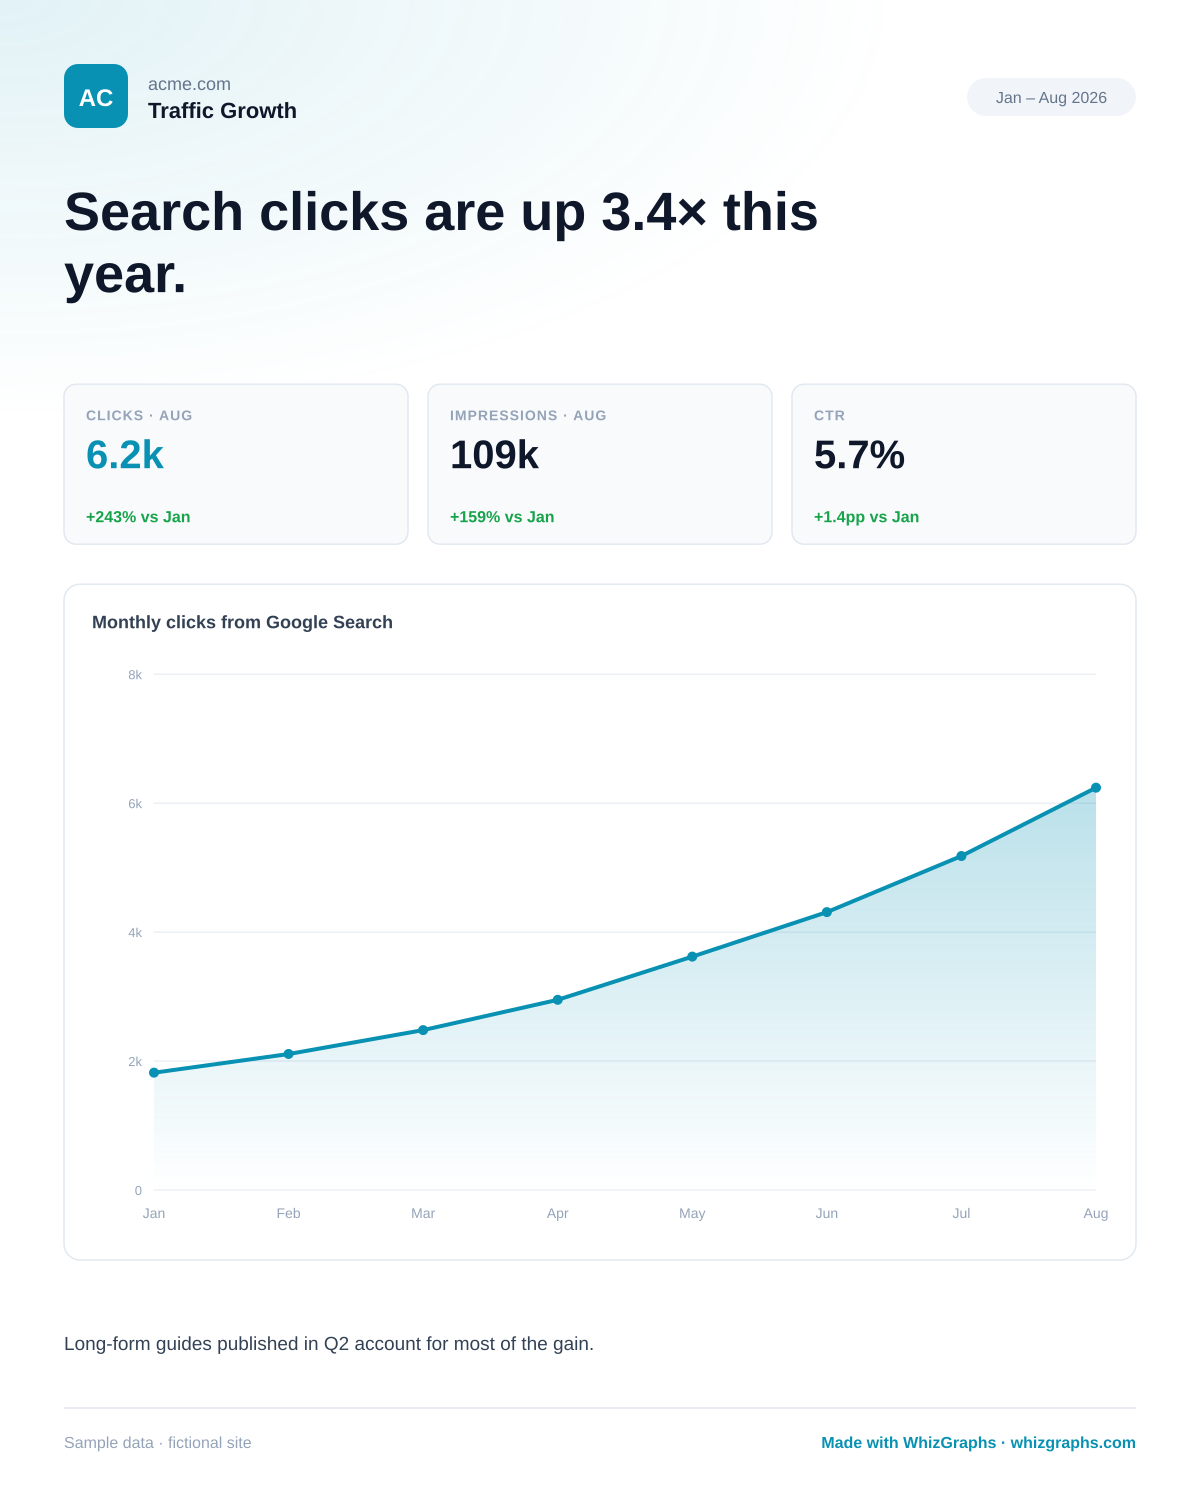
Traffic Growth SEO infographic example: Search clicks are up 3.4× this year. (sample data for acme.com)
Traffic Growth template — sample data for a fictional site.
Search intent, untangled

Two kinds of SEO infographic

People mean two different things by “SEO infographic”. Knowing which you need saves a lot of wasted design time.

Reporting infographics

A visual summary of your search performance, built from Google Search Console: is traffic growing, which pages carry the site, which keywords moved. Sent to clients, managers, investors or your own team instead of a spreadsheet.

See the five templates

Infographics as SEO content

A graphic you publish so other sites link to it and image search sends visitors — the classic “infographics for SEO” tactic. It only works when the graphic says something original and is published in a way crawlers can index.

Jump to the image-SEO checklist
The five templates

One SEO infographic template per question you get asked

Each image below is a finished template rendered from sample Search Console data. Click any one for the full-size PNG.

Trend

Traffic Growth infographic

What it reads
Monthly clicks and impressions over your date range, plotted as a trend with three headline tiles and their change.
The question it answers
“Is search traffic actually growing, and how fast?”
Best for
Founder and investor updates, and any recurring report where the story is momentum.
Use the Traffic Growth template
Traffic Growth SEO infographic example: Search clicks are up 3.4× this year. (sample data for acme.com)
Traffic Growth template — Search clicks are up 3.4× this year. PNG
Pages

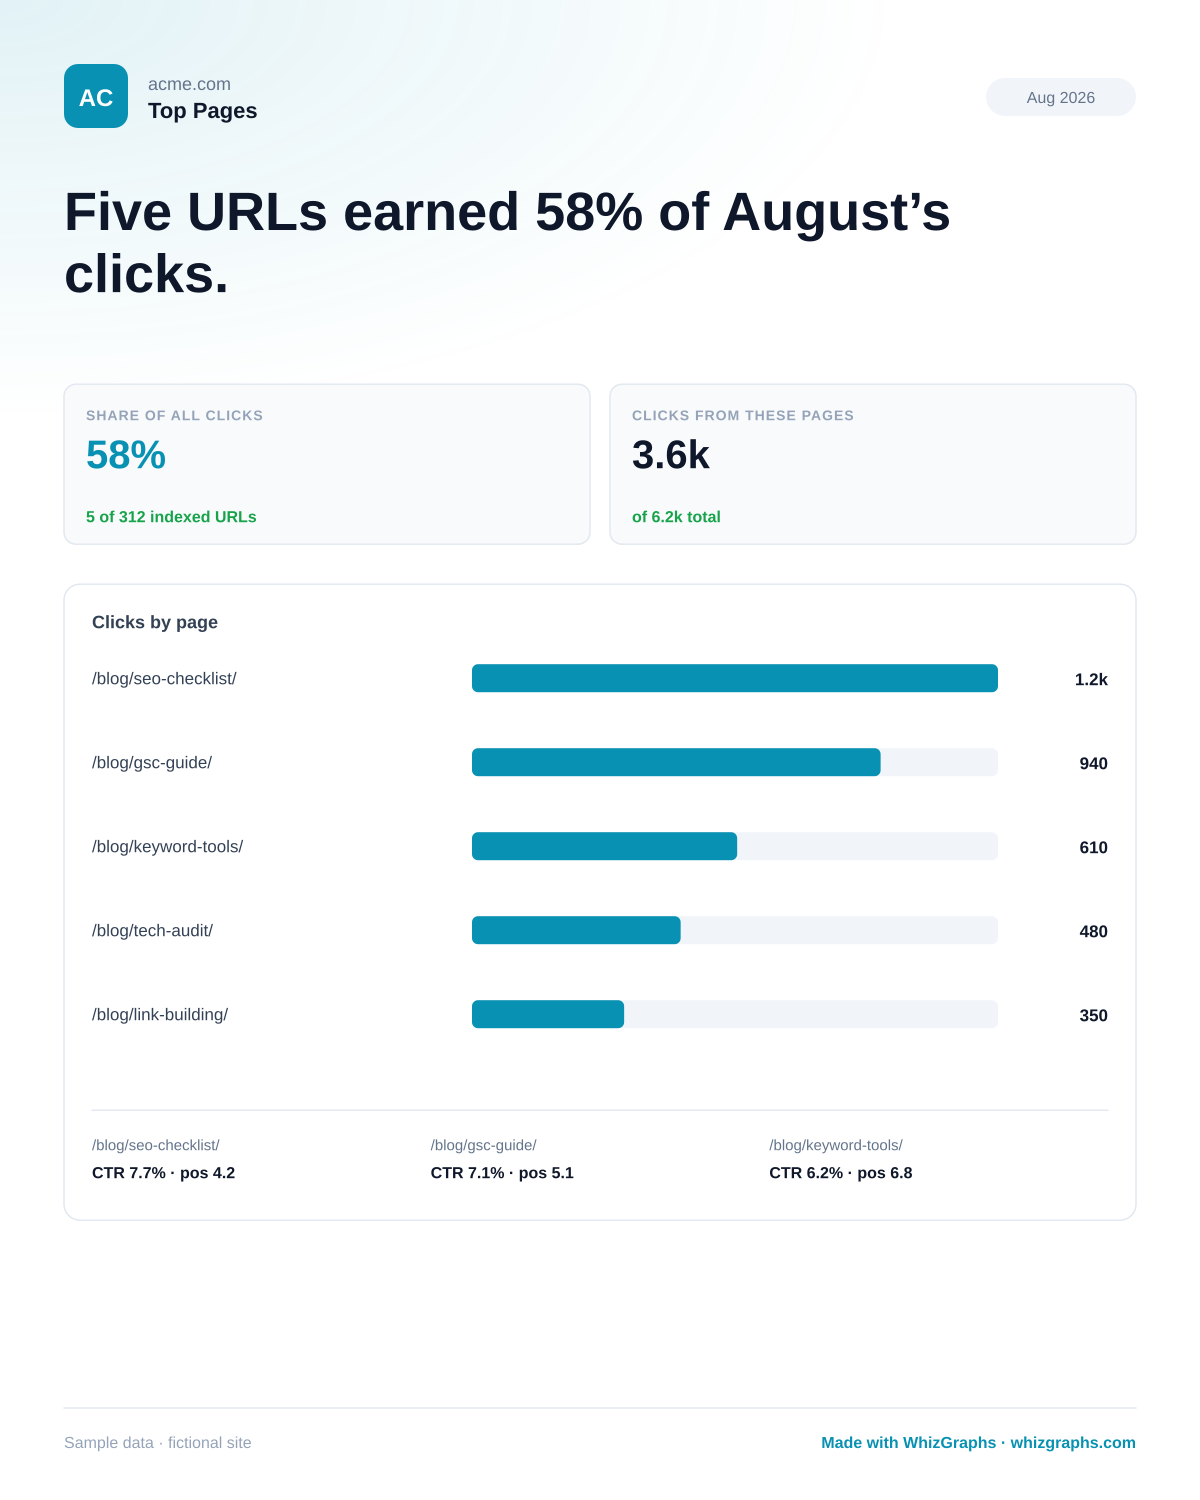
Top Pages infographic

What it reads
Your best URLs ranked by clicks, plus the share of all clicks they earn and each page’s CTR and position.
The question it answers
“Which handful of pages is carrying the whole site?”
Best for
Content audits and deciding where the next refresh or internal links should go.
Use the Top Pages template
Top Pages SEO infographic example: Five URLs earned 58% of August’s clicks. (sample data for acme.com)
Top Pages template — Five URLs earned 58% of August’s clicks. PNG
Keywords

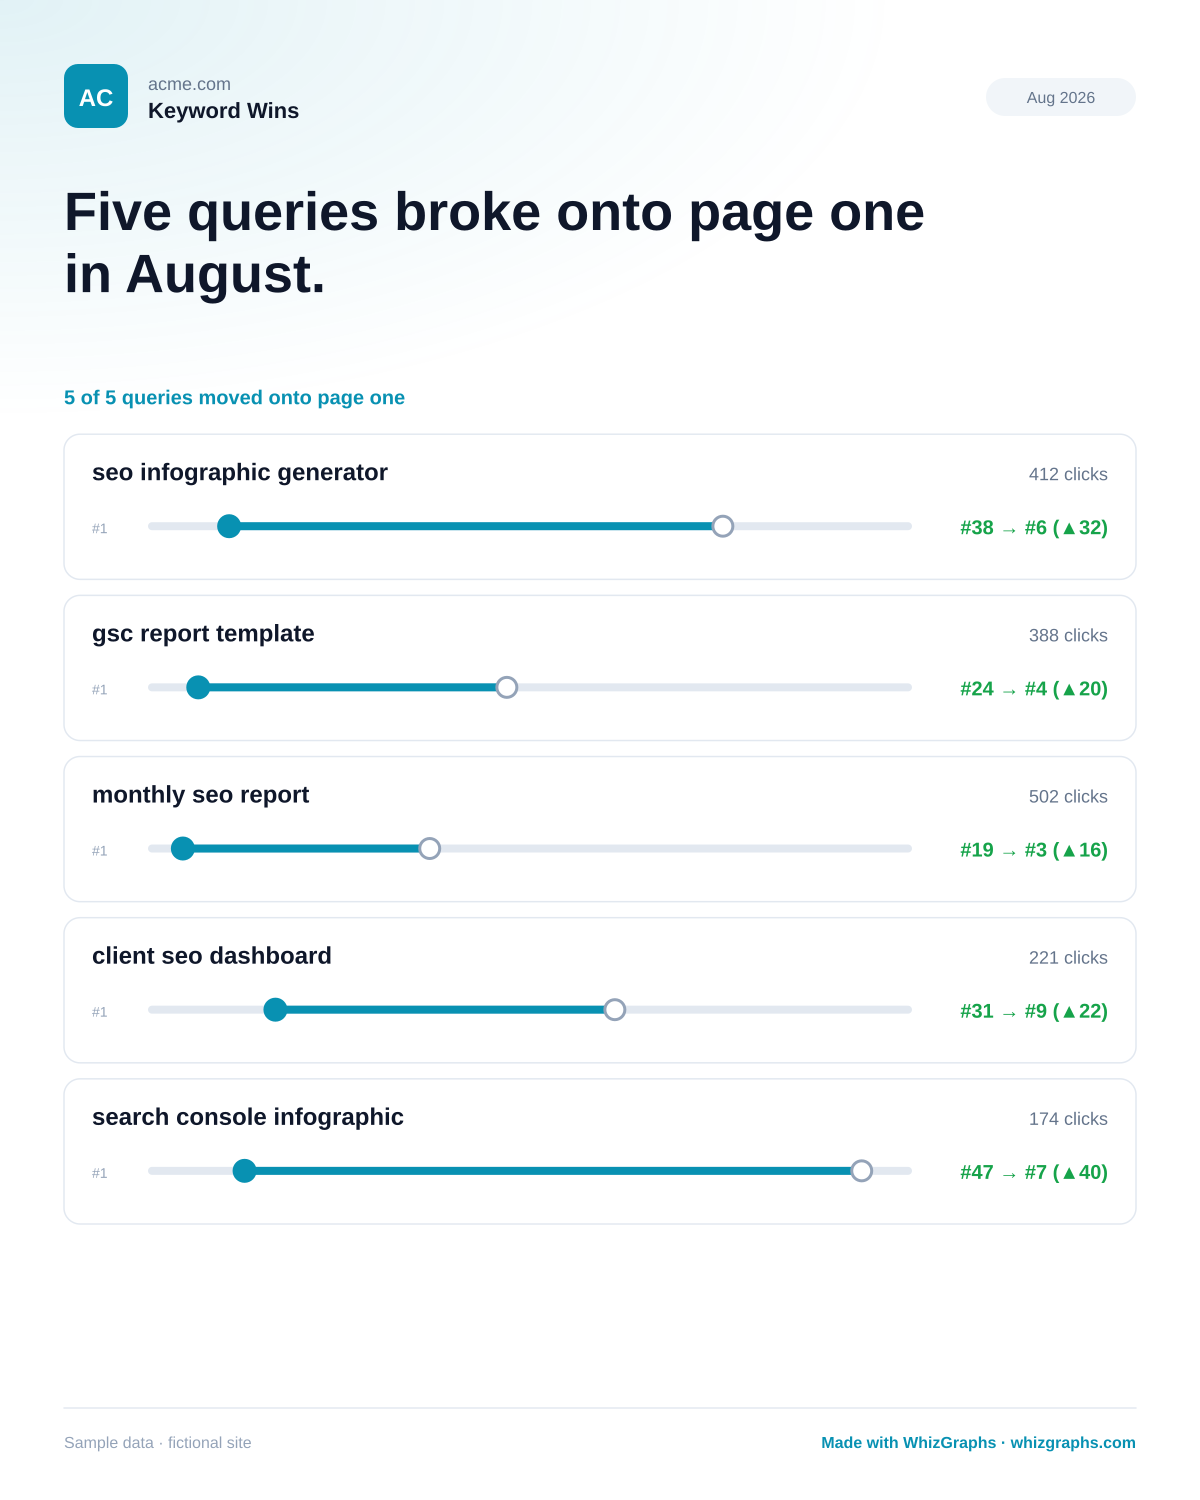
Keyword Wins infographic

What it reads
Queries whose average position improved, drawn as before → after tracks with the clicks each now earns.
The question it answers
“What broke onto page one since last month?”
Best for
Proving a retainer is working — ranking movement a client can see in seconds.
Use the Keyword Wins template
Keyword Wins SEO infographic example: Five queries broke onto page one in August. (sample data for acme.com)
Keyword Wins template — Five queries broke onto page one in August. PNG
Content

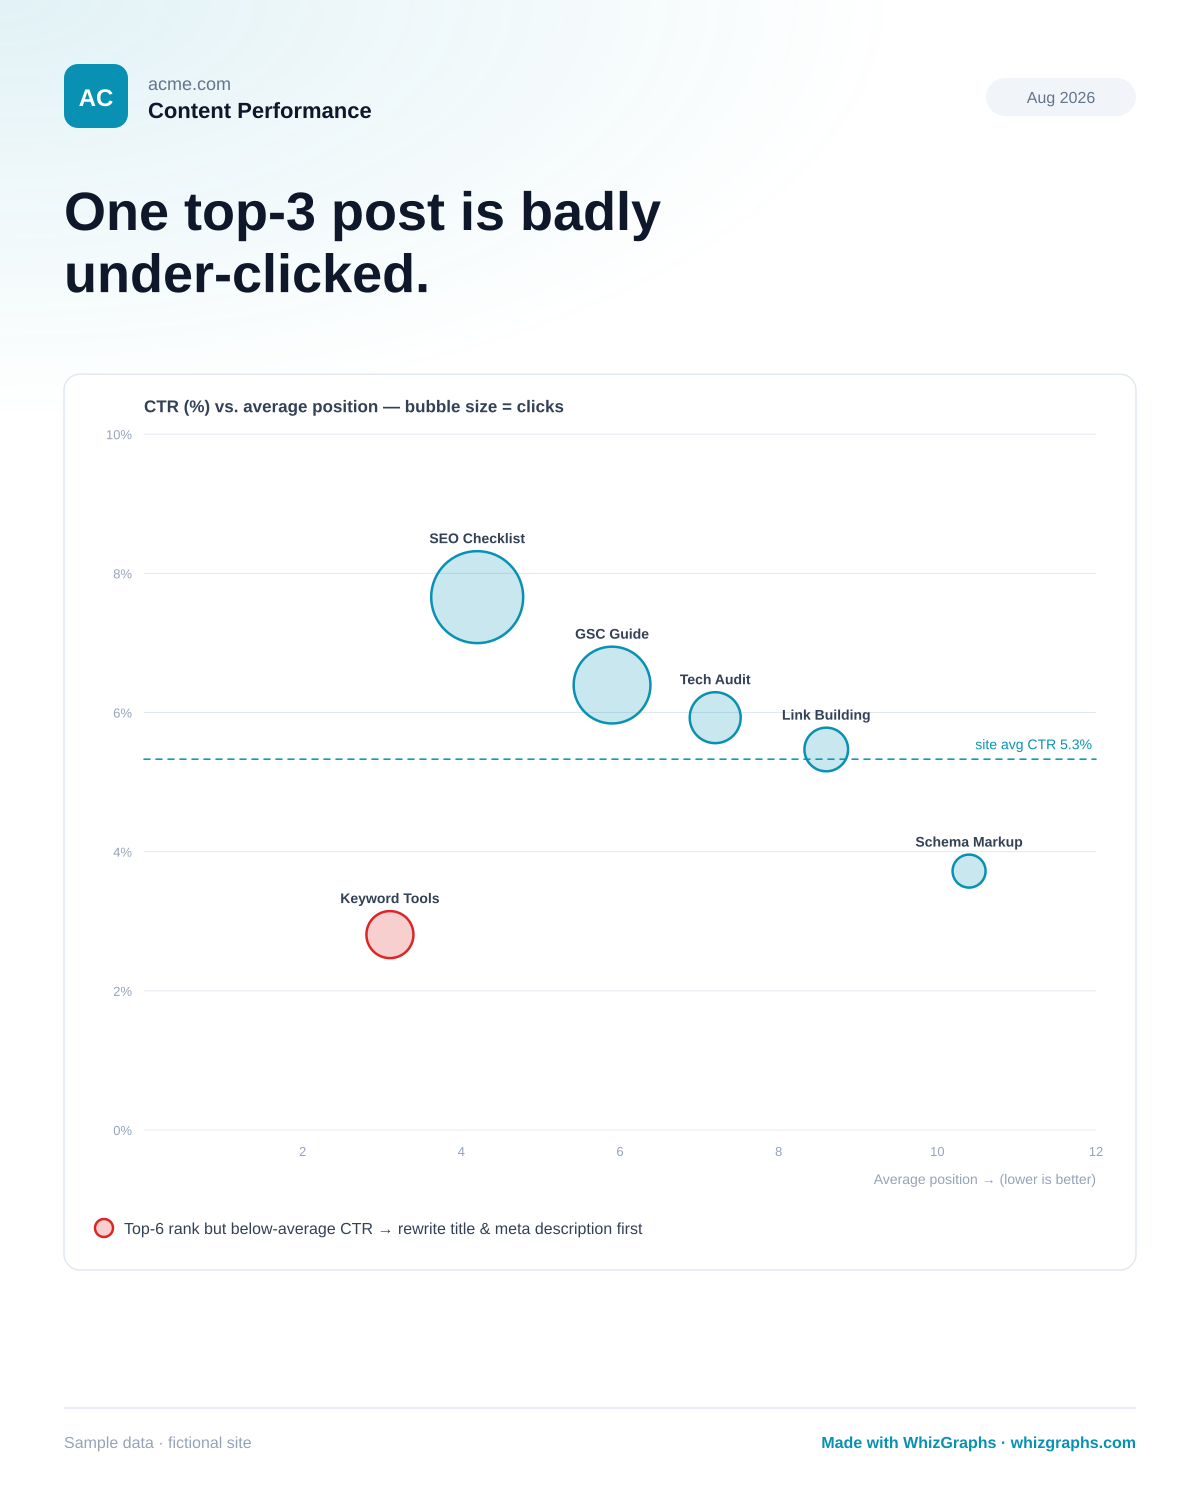
Content Performance infographic

What it reads
Every article plotted by CTR against average position, bubble size scaled to clicks, with the site’s average CTR as a reference line.
The question it answers
“Which posts under-perform the rank they already hold?”
Best for
Editorial planning — finding well-ranked, under-clicked pages that need a better title, not more links.
Use the Content Performance template
Content Performance SEO infographic example: One top-3 post is badly under-clicked. (sample data for acme.com)
Content Performance template — One top-3 post is badly under-clicked. PNG
Snapshot

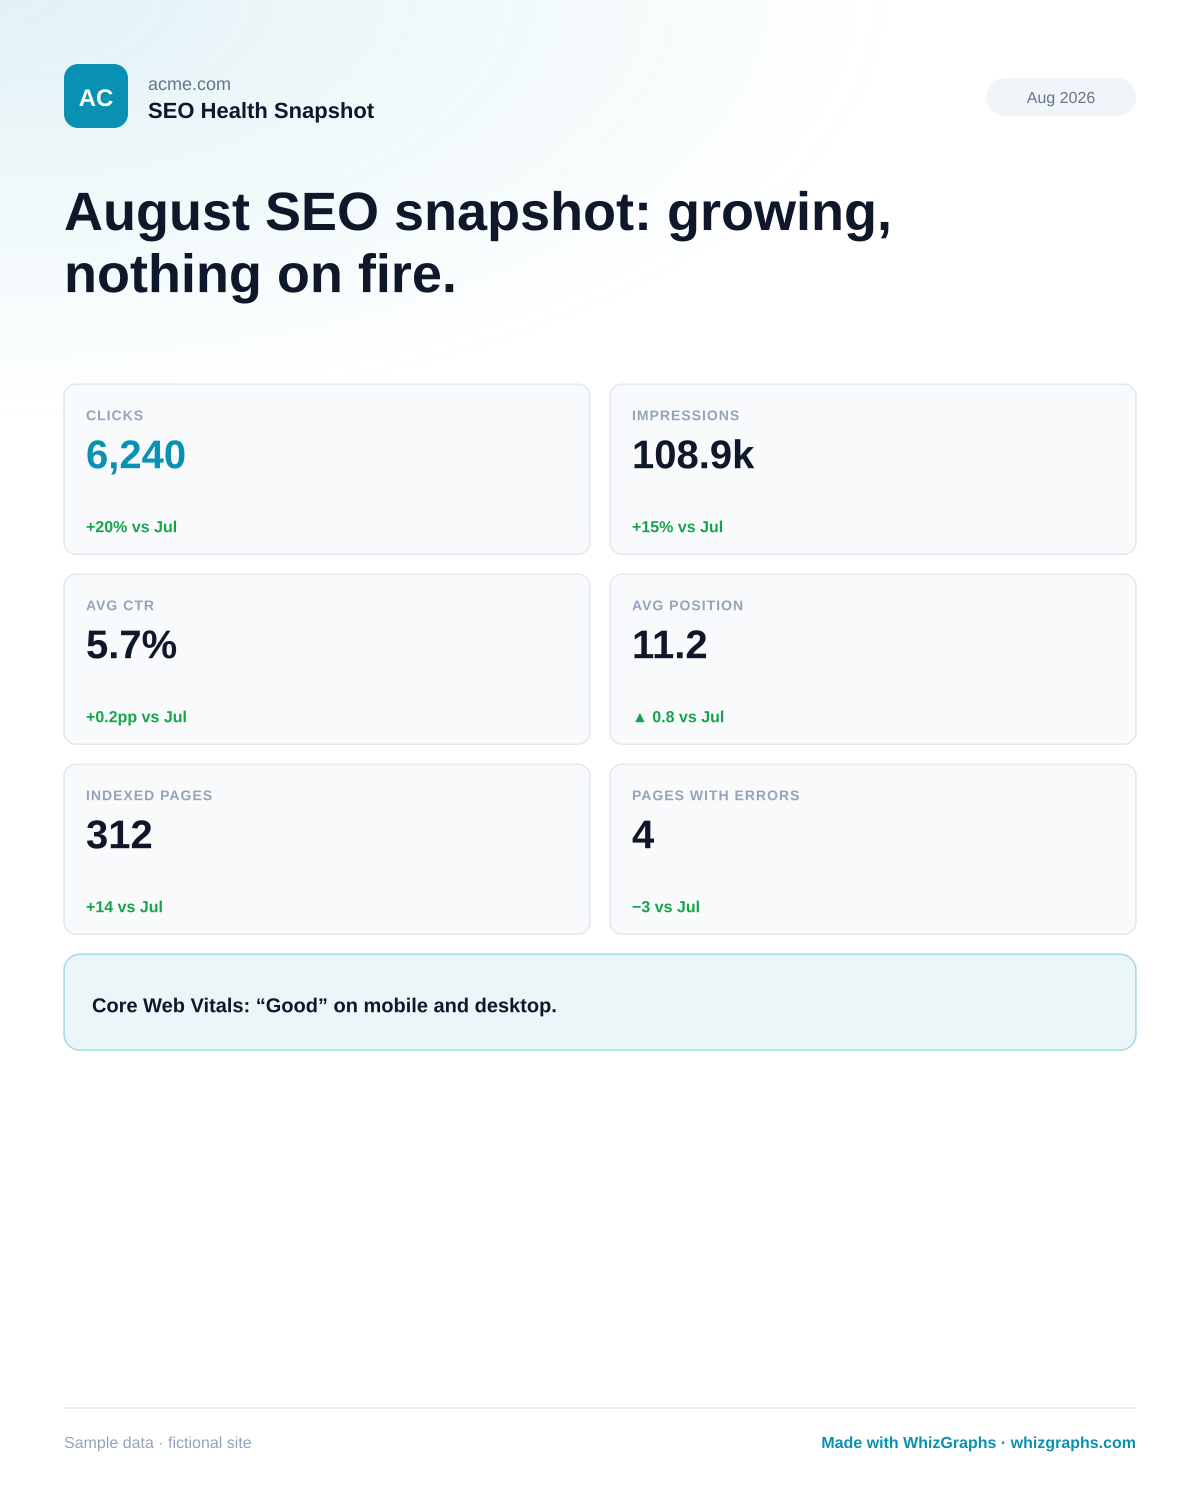
SEO Health Snapshot infographic

What it reads
Six totals in a grid — clicks, impressions, CTR, position, indexed pages, errors — each with its change, plus a one-line verdict.
The question it answers
“What’s the one-glance state of our search visibility?”
Best for
Quarterly reviews and exec summaries where nobody wants a chart, just the number and whether it’s OK.
Use the SEO Health Snapshot template
SEO Health Snapshot SEO infographic example: August SEO snapshot: growing, nothing on fire. (sample data for acme.com)
SEO Health Snapshot template — August SEO snapshot: growing, nothing on fire. PNG
Anatomy

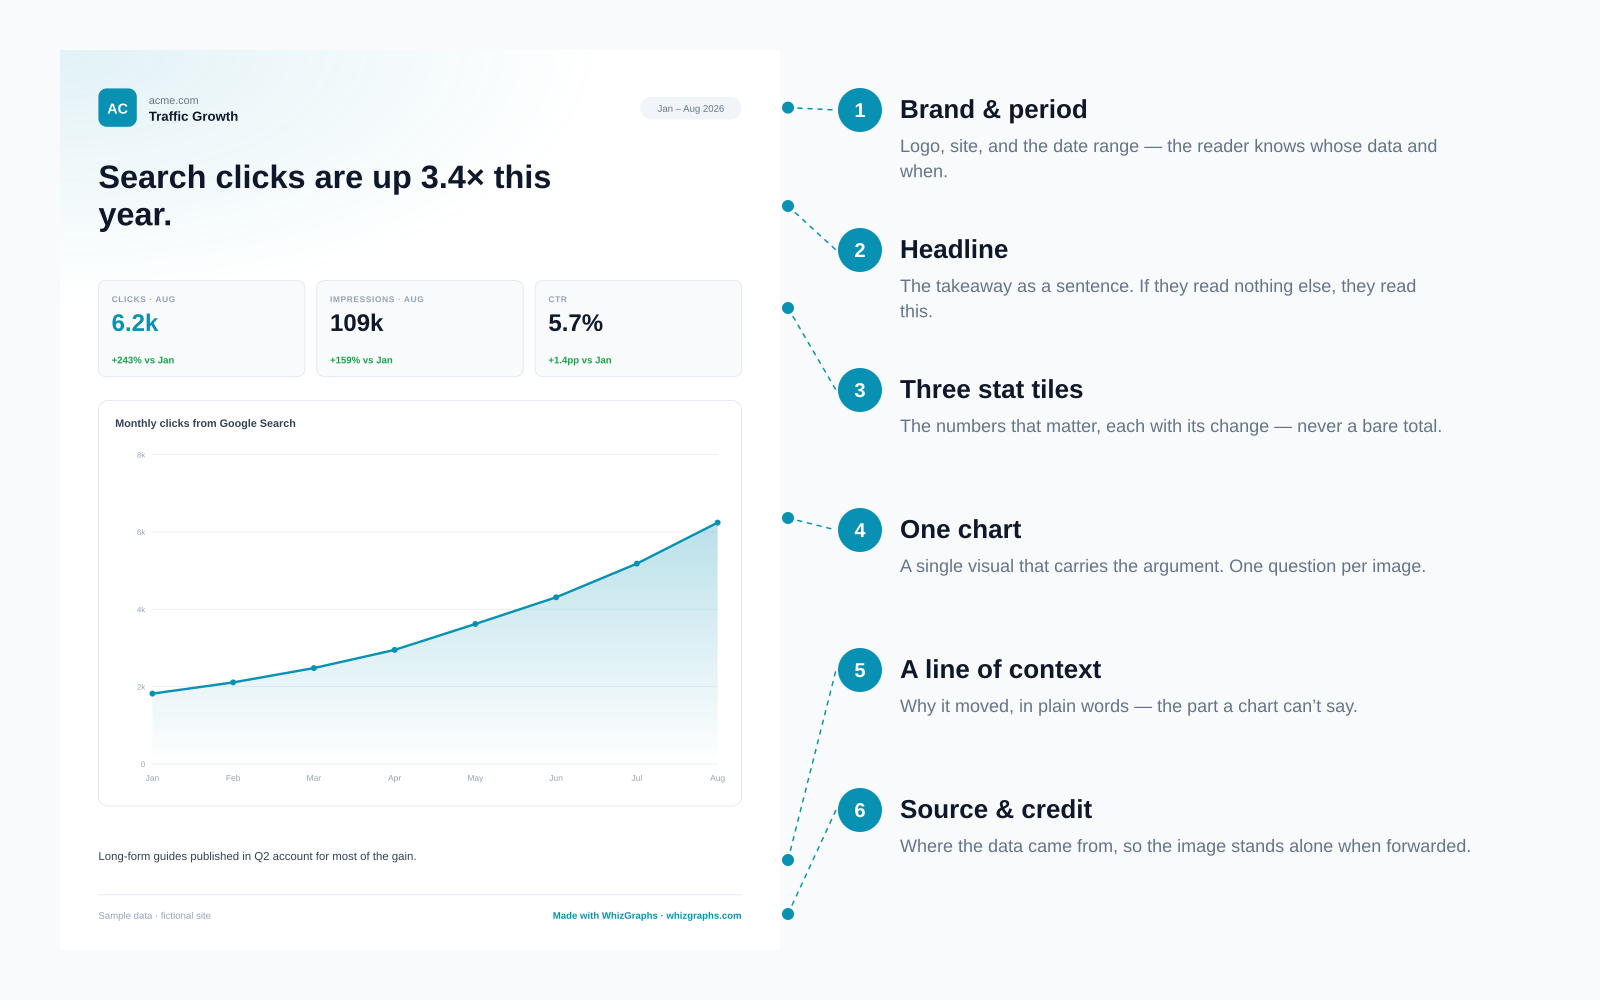
The six parts of a good SEO infographic

Every template above follows the same skeleton. If you design your own in Canva, Figma or slides, keep these six parts and you’ll rarely go wrong.

Annotated anatomy of an SEO infographic: brand and period, headline, stat tiles, one chart, context line, and source credit
The six parts every SEO infographic needs.
How to

How to make an SEO infographic from Search Console data

The same process works whether you use WhizGraphs, a design tool, or a spreadsheet chart.

  1. 1

    Start from the question, not the data

    Write down what your reader wants to know — “is it working?”, “what should we fix?” — and pick the one template that answers it.
  2. 2

    Pull the numbers from the Performance report

    In Search Console, open Performance → Search results, set the date range (and a comparison period), then export the Dates, Queries or Pages tab. The GSC infographic report guide shows which tab feeds which template.
  3. 3

    Compute the change, not just the total

    Percent change for clicks and impressions, percentage points for CTR, places gained for position. The delta is the story.
  4. 4

    Write the headline last

    Once you can see the chart, say what it means in one plain sentence. That sentence goes at the top, largest.
  5. 5

    Brand it and add the period and source

    Logo, brand color, date range, “Source: Google Search Console”. The image must make sense when forwarded without context.
  6. 6

    Export once, share everywhere

    A PNG for Slack, email and decks; the same image at the top of a fuller report if one is needed.
Infographics for SEO

Publishing infographics that get indexed and linked

If you publish infographics to earn links or image-search traffic, how you publish matters as much as the design. This checklist is exactly what this page does with its own graphics.

  • Publish it as a real image file

    An <img> with a src Google can fetch. Charts drawn only in JavaScript, CSS backgrounds, or canvas are invisible to image search.

  • Give it a descriptive file name

    seo-infographic-keyword-wins.png tells a crawler more than IMG_0042.png before it reads a single pixel.

  • Write alt text that states the finding

    Not “chart” — “Keyword wins for August: five queries moved onto page one”. Alt text is read by screen readers and search engines alike.

  • Put the key numbers in the page text too

    Search engines can’t reliably read text inside an image. Repeat the headline and the important figures in HTML next to it.

  • Set width and height, and compress

    Explicit dimensions prevent layout shift; a lean file keeps the page fast. SVG for the page, PNG for sharing works well.

  • Offer an embed snippet with a credit link

    If others republish your graphic, a ready-made snippet makes the attribution link the default rather than an afterthought.

  • Don’t bury the only copy in a PDF or a carousel

    Images inside PDFs and lazy carousels are often never discovered. Give each important graphic its own crawlable spot on a page.

  • Don’t publish someone else’s numbers without a source

    Original data is what earns links; recycled statistics without attribution earn neither trust nor citations.

Every WhizGraphs graphic is free to embed with this snippet. The credit link is the whole trade.

Avoid these

Five mistakes that make SEO infographics unreadable

Six charts on one image

An infographic is not a dashboard screenshot. If it needs a legend for the legend, split it.

A metric label as the headline

“Clicks by month” describes the chart. “Clicks tripled since January” tells the story.

Totals with no comparison

18,420 clicks means nothing alone. Versus last month, or the same month last year, it means something.

Average position without context

Position is an average across every impression, so a page-one jump on a long-tail query can move it more than a real win. Show which queries moved.

No date range or source

Forwarded images lose their email. The period and “Source: Google Search Console” should be on the image itself.

Frequently asked questions

What is an SEO infographic?

The term is used two ways. Most often it means a single image that summarises a site’s search performance — clicks, impressions, rankings, top pages — so a non-specialist can understand it at a glance. It is also used for infographics published as SEO content, to earn links and image-search traffic. WhizGraphs makes the first kind; the image-SEO section on this page covers the second.

Are infographics still good for SEO?

They can be, when they carry something original — your own data, a clear framework — and are published so search engines can index them: a real image file, descriptive alt text, and the key facts repeated in the page text. Generic infographics that restate common statistics rarely earn links any more.

Which SEO infographic template should I start with?

For a monthly update, Traffic Growth. To prove progress to a client, Keyword Wins. To decide what to work on next, Top Pages and Content Performance. For an exec summary, the SEO Health Snapshot.

How is an SEO infographic different from a dashboard?

A dashboard is for exploring: many widgets, filters and tabs, checked by the person doing the work. An infographic is for communicating one finding to someone who won’t open the dashboard. See the SEO dashboard template page for the exploration side.

Can I use these images?

Yes — every graphic on this page is free to embed with a credit link back to WhizGraphs. The numbers shown are sample data for fictional sites, so use them to illustrate the format, not as benchmarks.

Do I need to connect Google Search Console?

Not today. The WhizGraphs app runs on realistic mock Search Console data so you can build any template immediately. Live Search Console sync is rolling out gradually.

Pick a template and make your first SEO infographic today.

Create your first SEO infographic