SEO infographic examples
Ten SEO infographics built from Search Console-style data — growth stories, recoveries, keyword wins, CTR fixes, brand vs non-brand, audience mix. Each is annotated with the story it tells and why it works, and each is a free full-size PNG.
All figures are sample data for fictional sites.
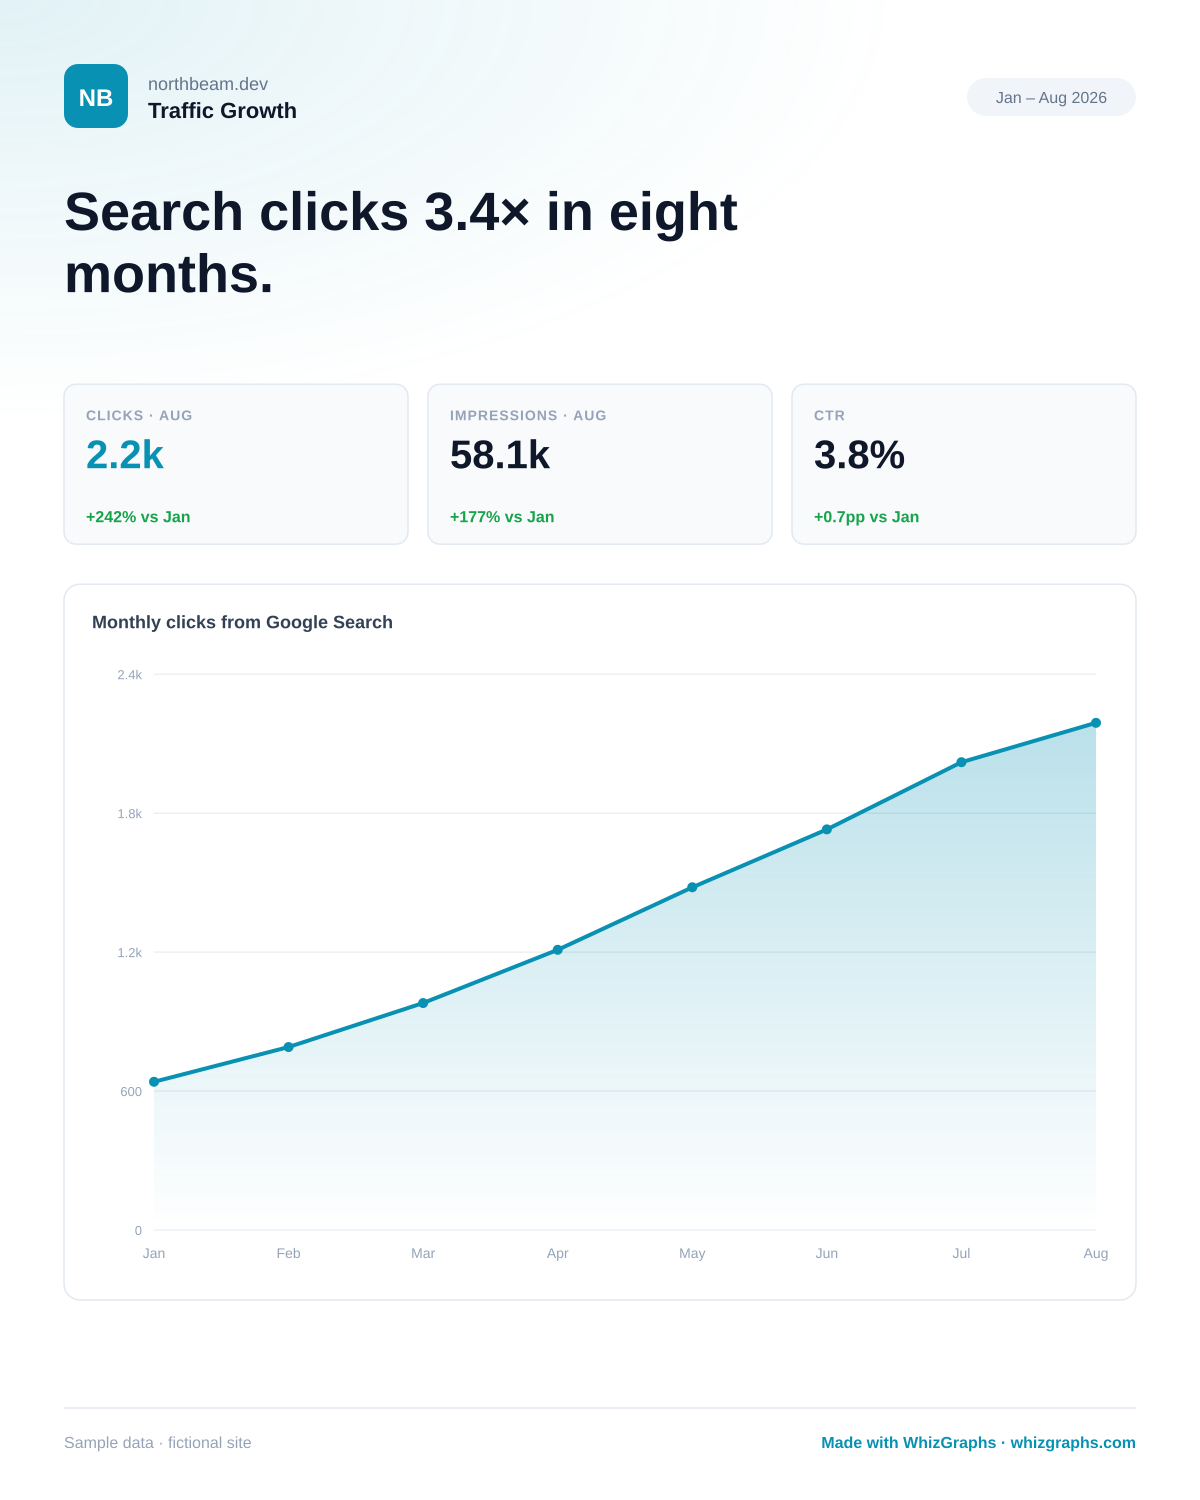
Search clicks 3.4× in eight months.
Eight months of compounding growth told in one rising line.
Why it works: One headline, three tiles, one chart. The investor gets “it’s working” before reading a single number.
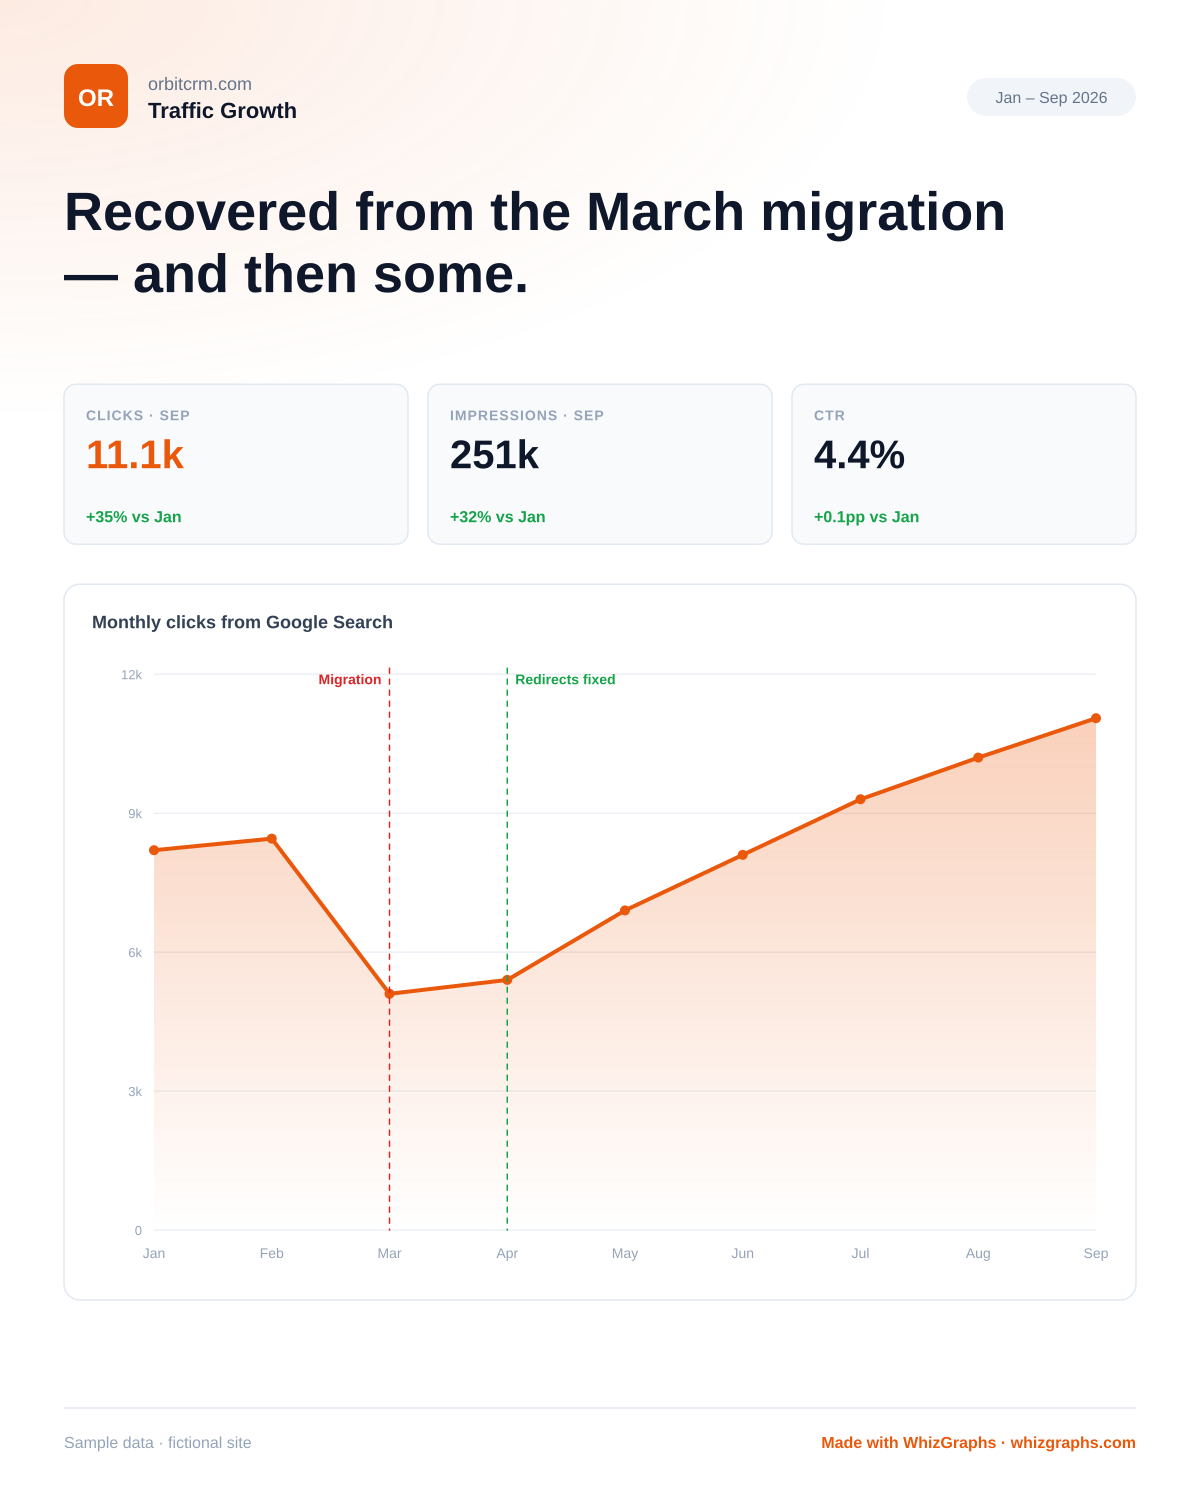
Recovered from the March migration — and then some.
A migration dip and the recovery, with both events marked on the chart.
Why it works: Annotations turn a scary dip into a story with a cause and a fix — the reader never has to ask “what happened in March?”
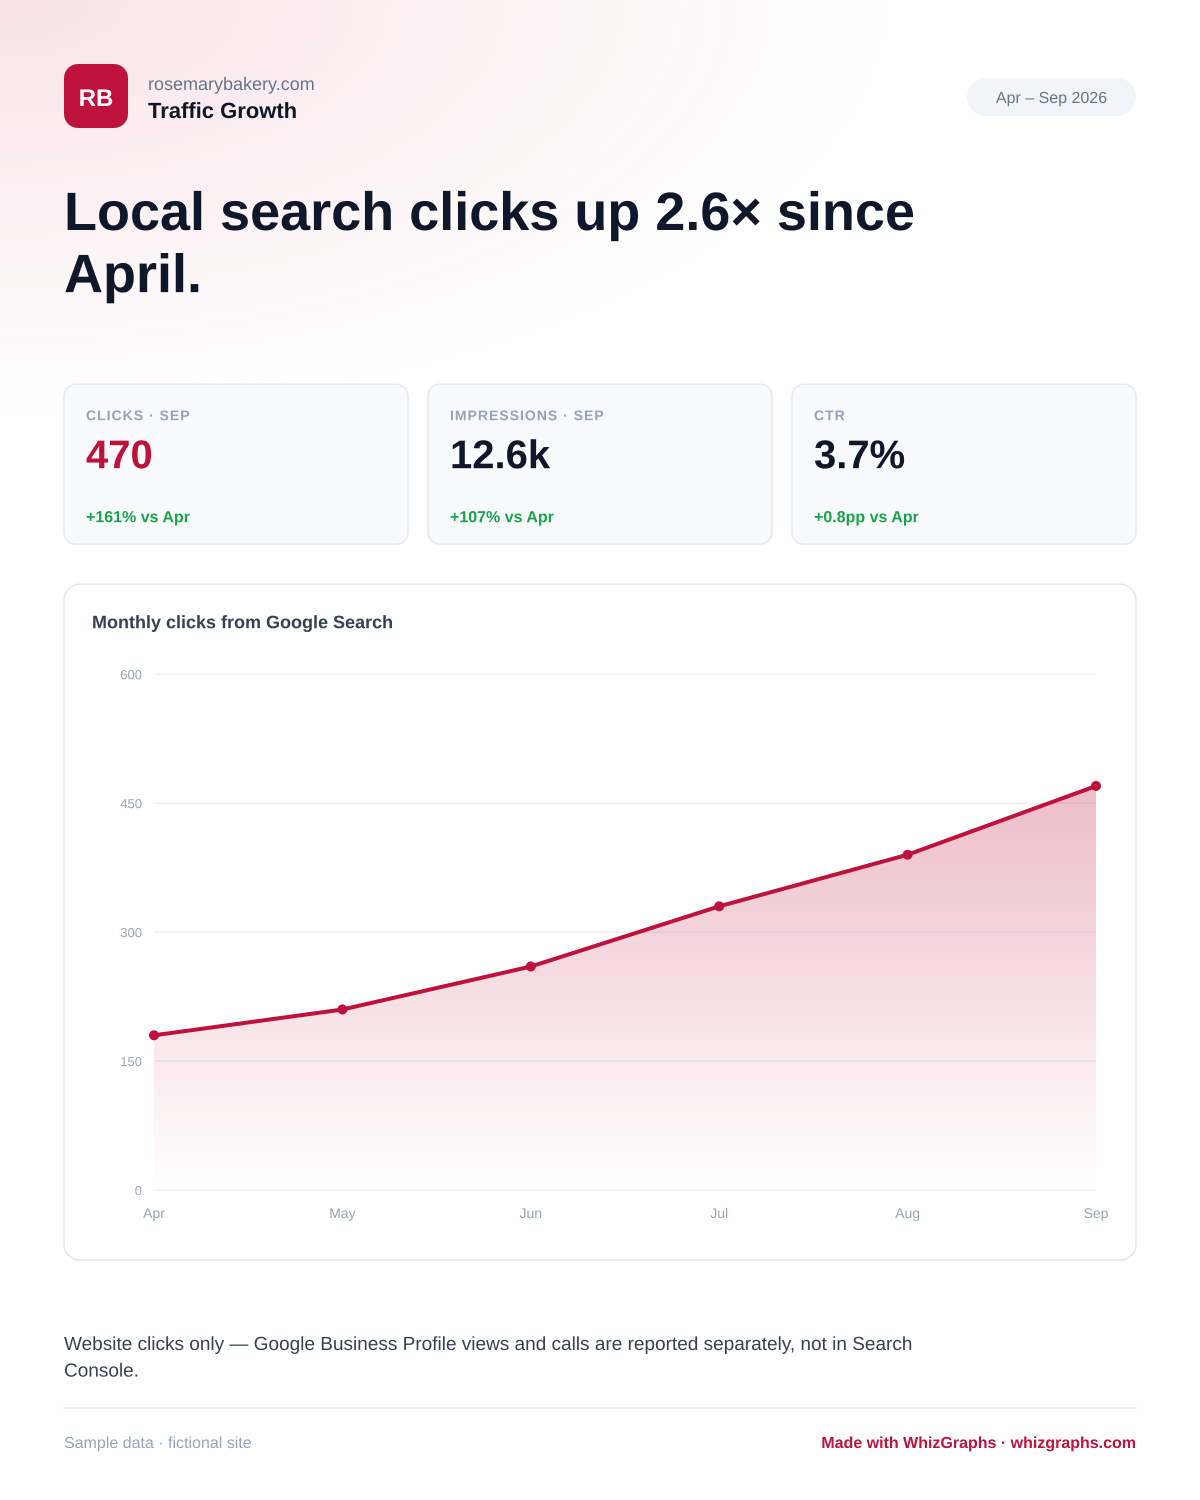
Local search clicks up 2.6× since April.
Small numbers, still a clear story — a local bakery’s first six months of SEO.
Why it works: Growth multiples read well at any scale. The note sets expectations about what Search Console does and doesn’t include.
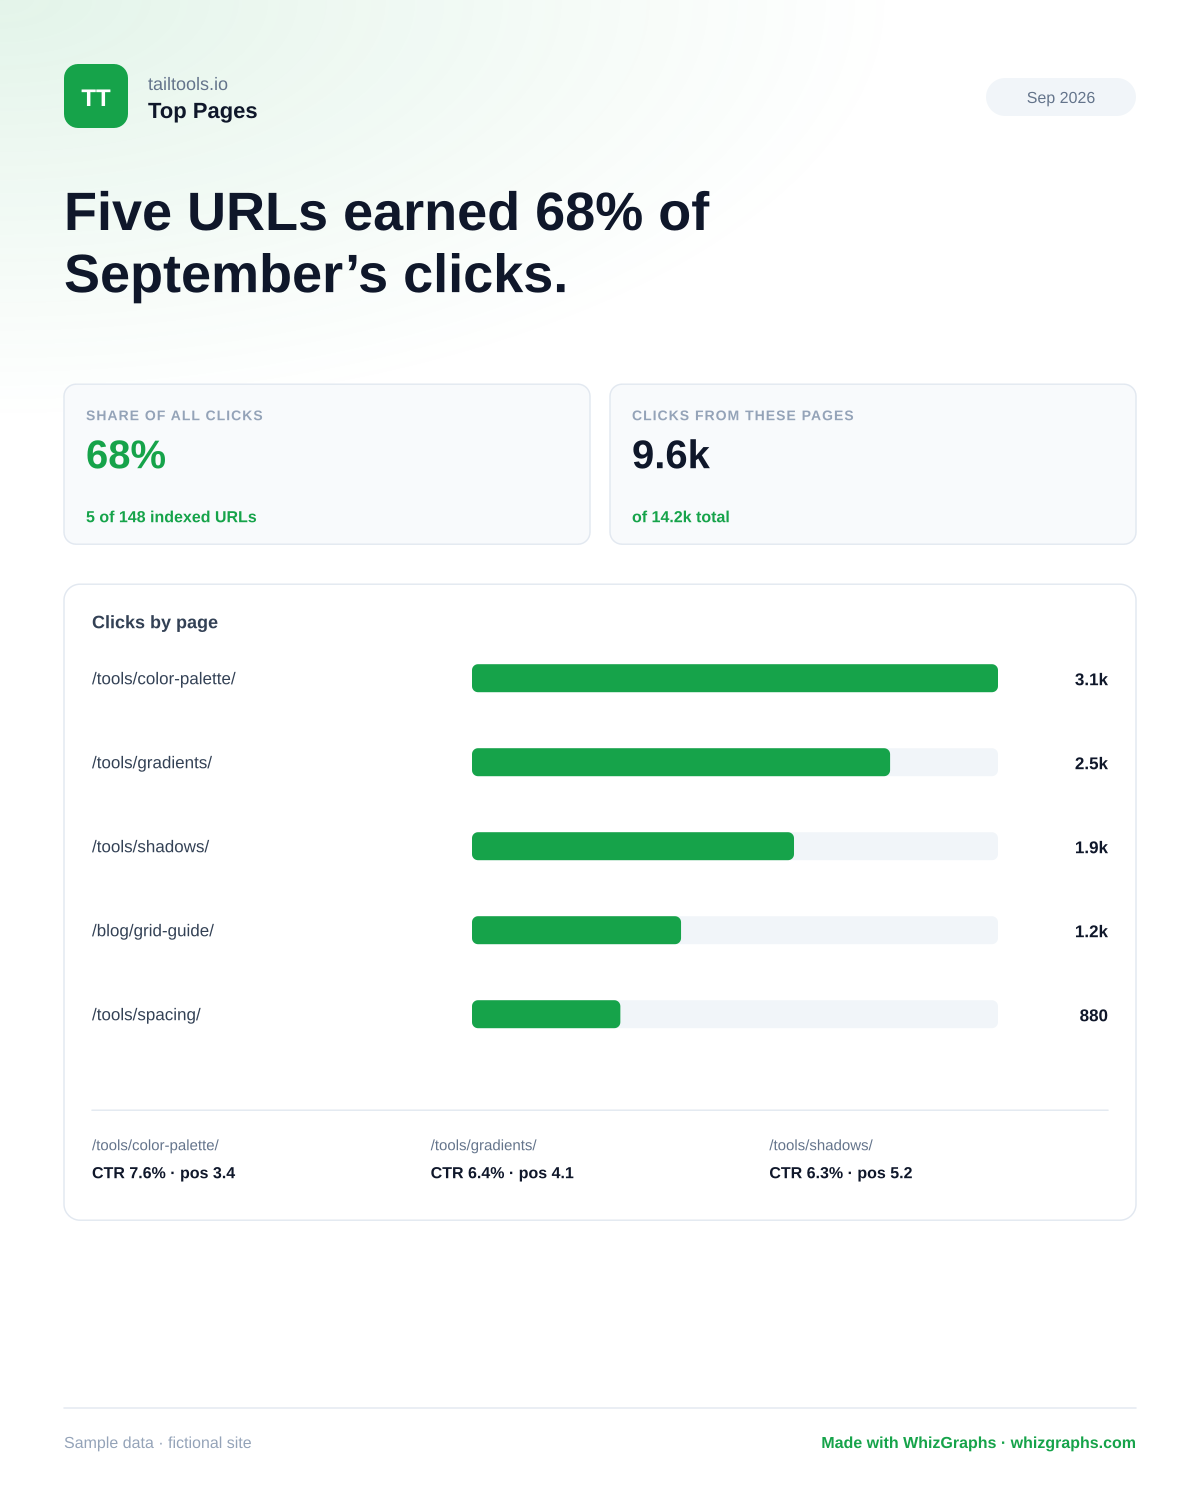
Five URLs earned 68% of September’s clicks.
Traffic is concentrated in a handful of free tools — and the bars make it obvious.
Why it works: Showing share of total clicks, not just raw clicks, is what makes the concentration land.
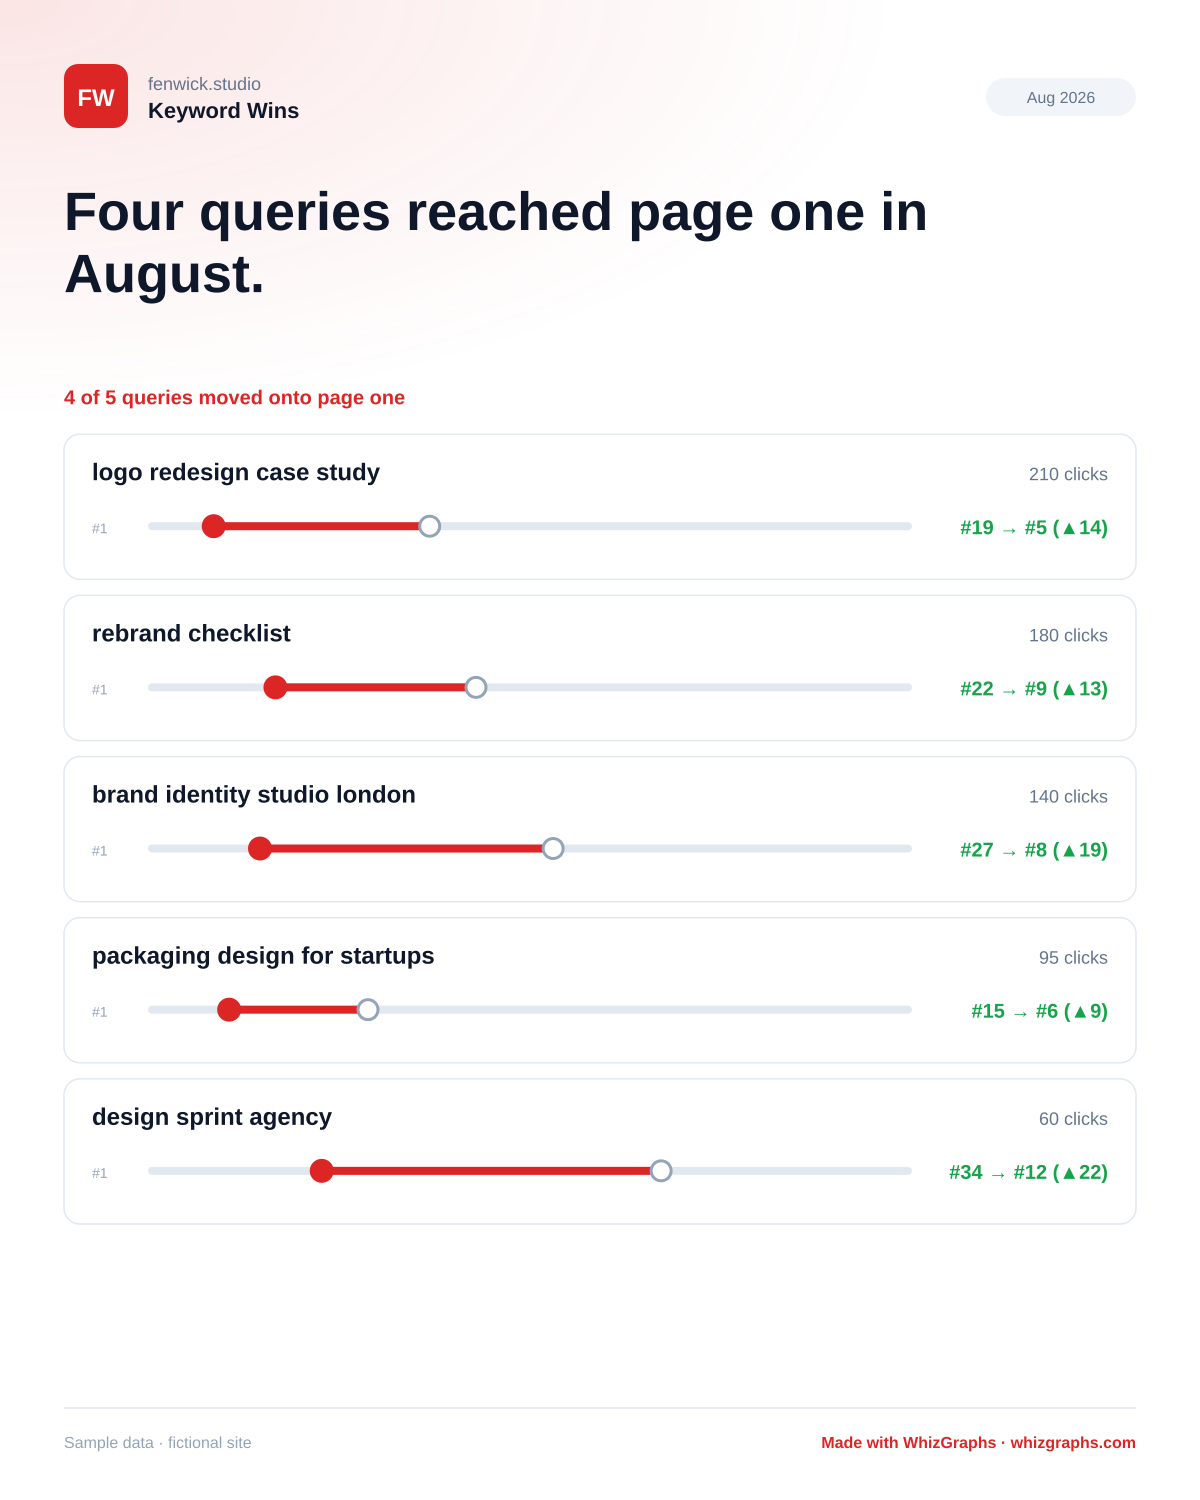
Four queries reached page one in August.
Queries that climbed this month, drawn as before → after tracks.
Why it works: Position jumps are the most tangible proof of progress you can hand a client — and the one that didn’t make page one is shown honestly.
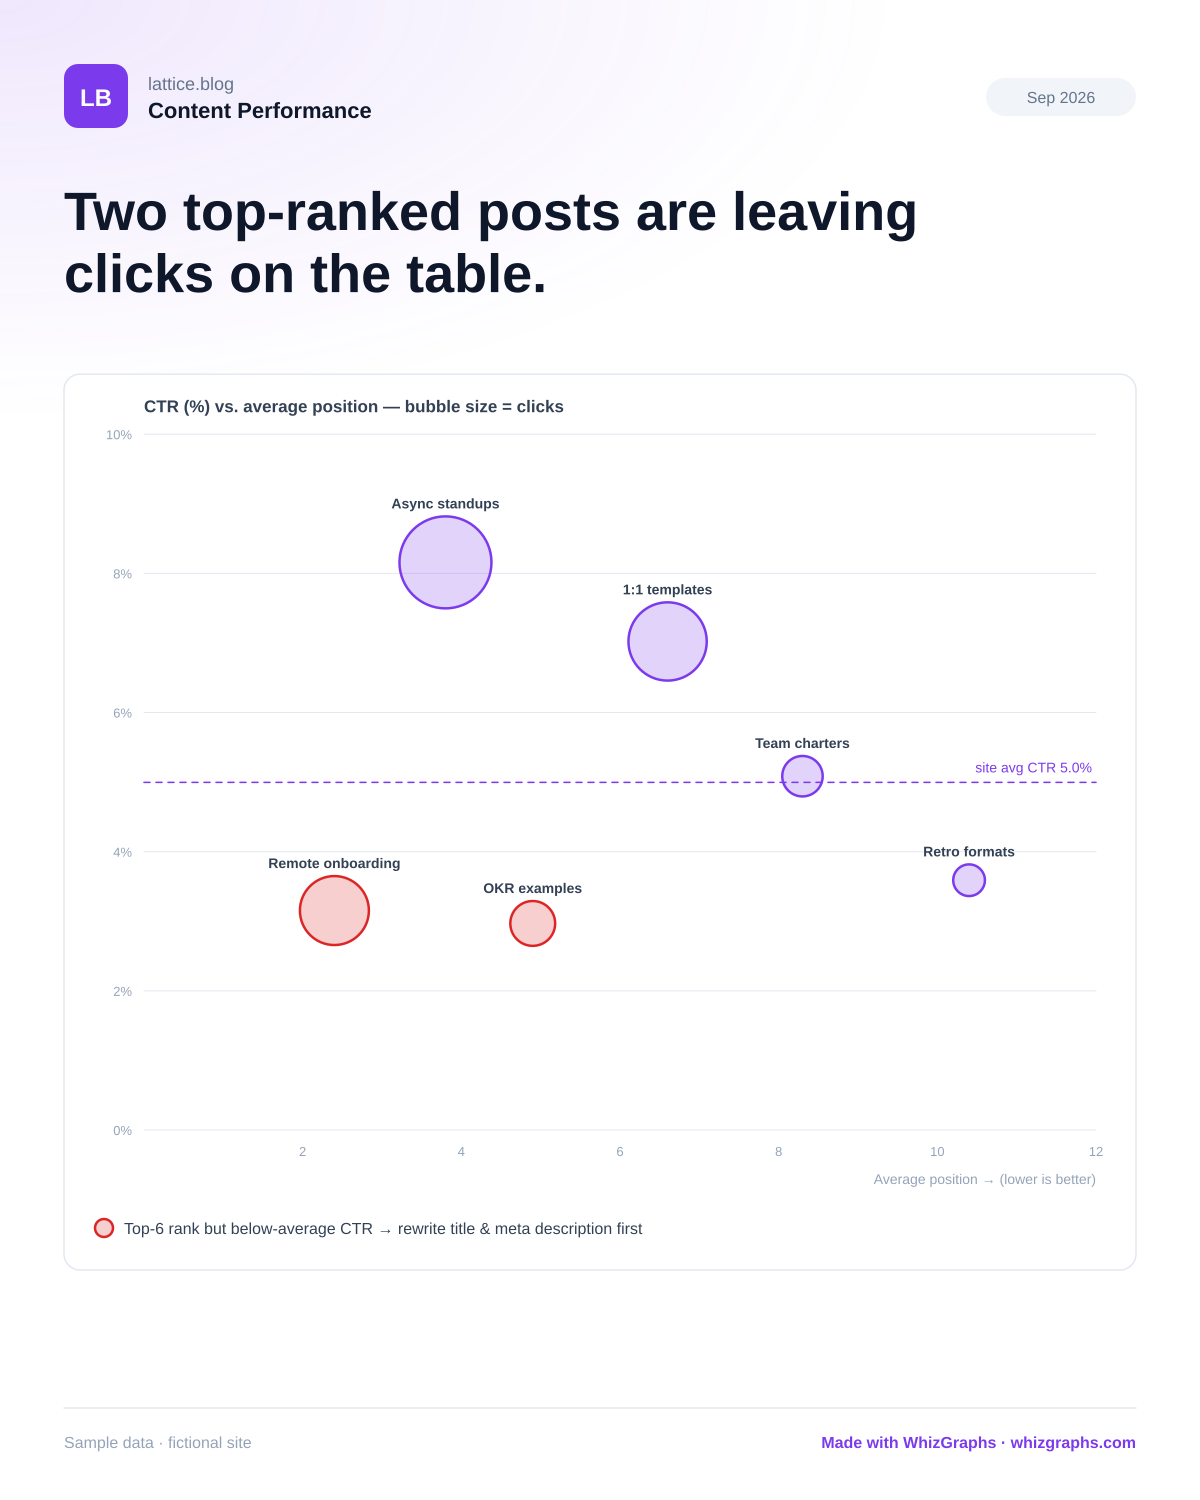
Two top-ranked posts are leaving clicks on the table.
Every article plotted by CTR against rank, sized by clicks.
Why it works: The two red bubbles rank in the top five but sit below the site’s average CTR — the cheapest wins on the board.
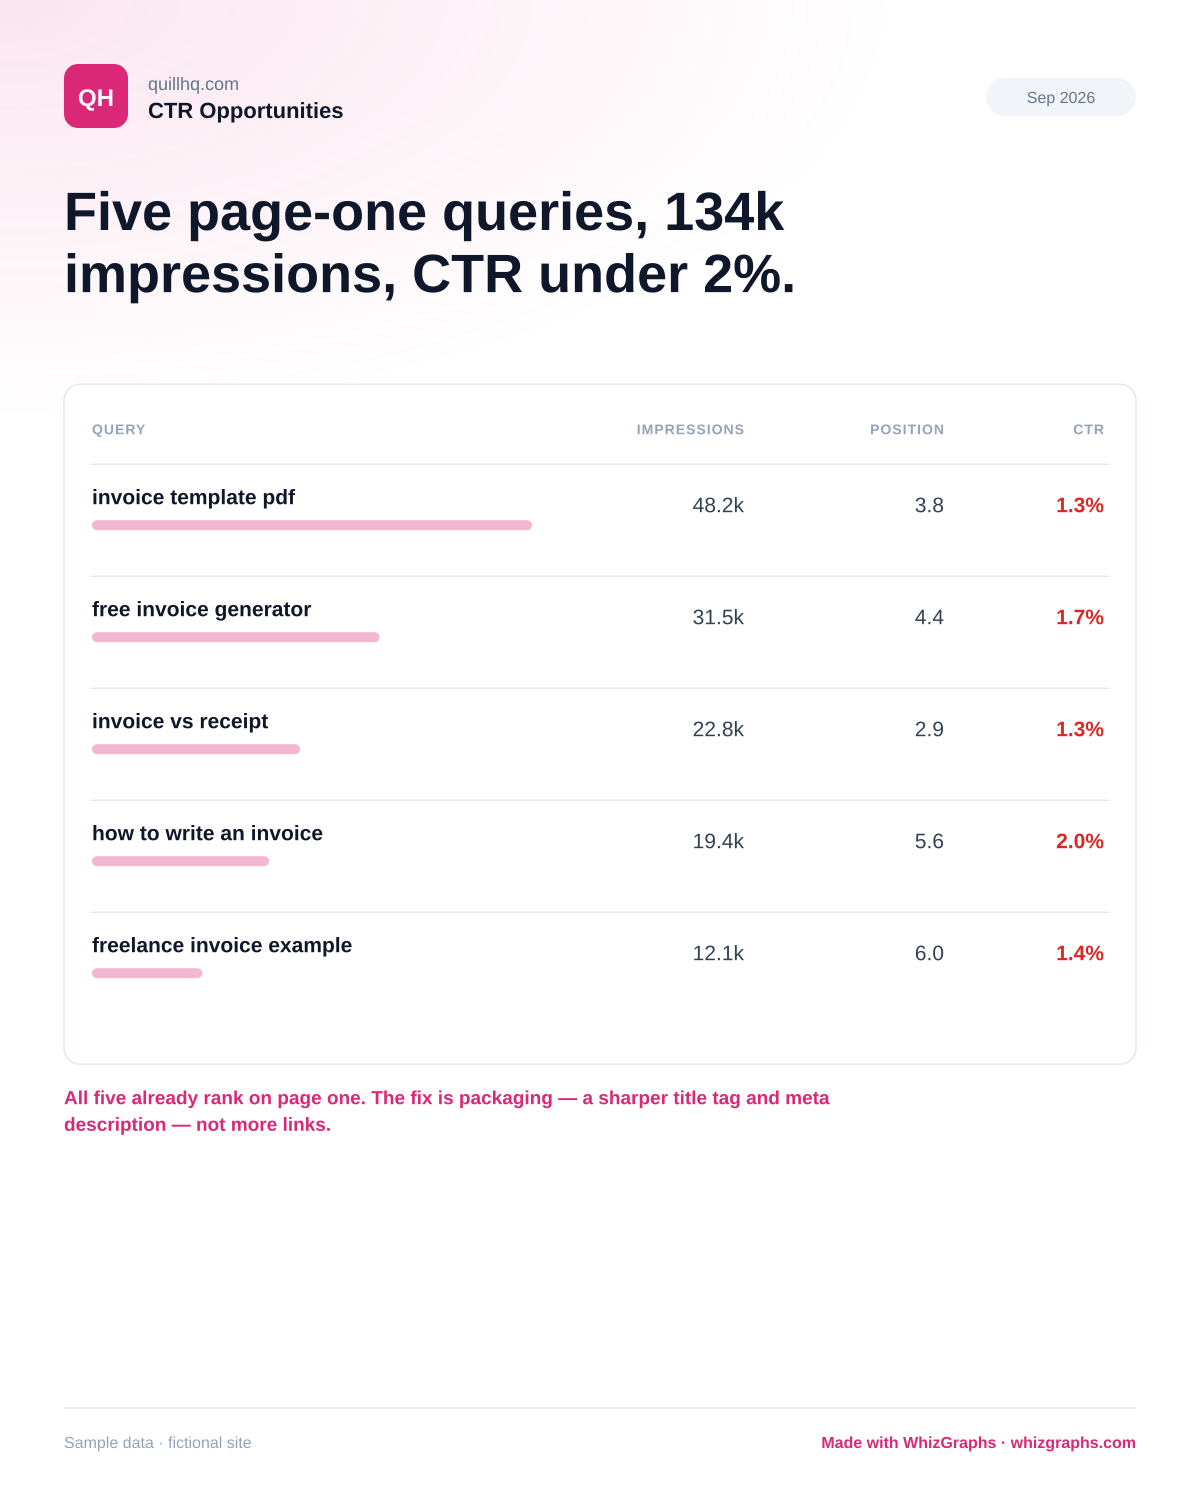
Five page-one queries, 134k impressions, CTR under 2%.
High-impression, low-CTR queries that already rank on page one.
Why it works: It ends with an action, not a number: rewrite five titles. That’s what makes a report useful.
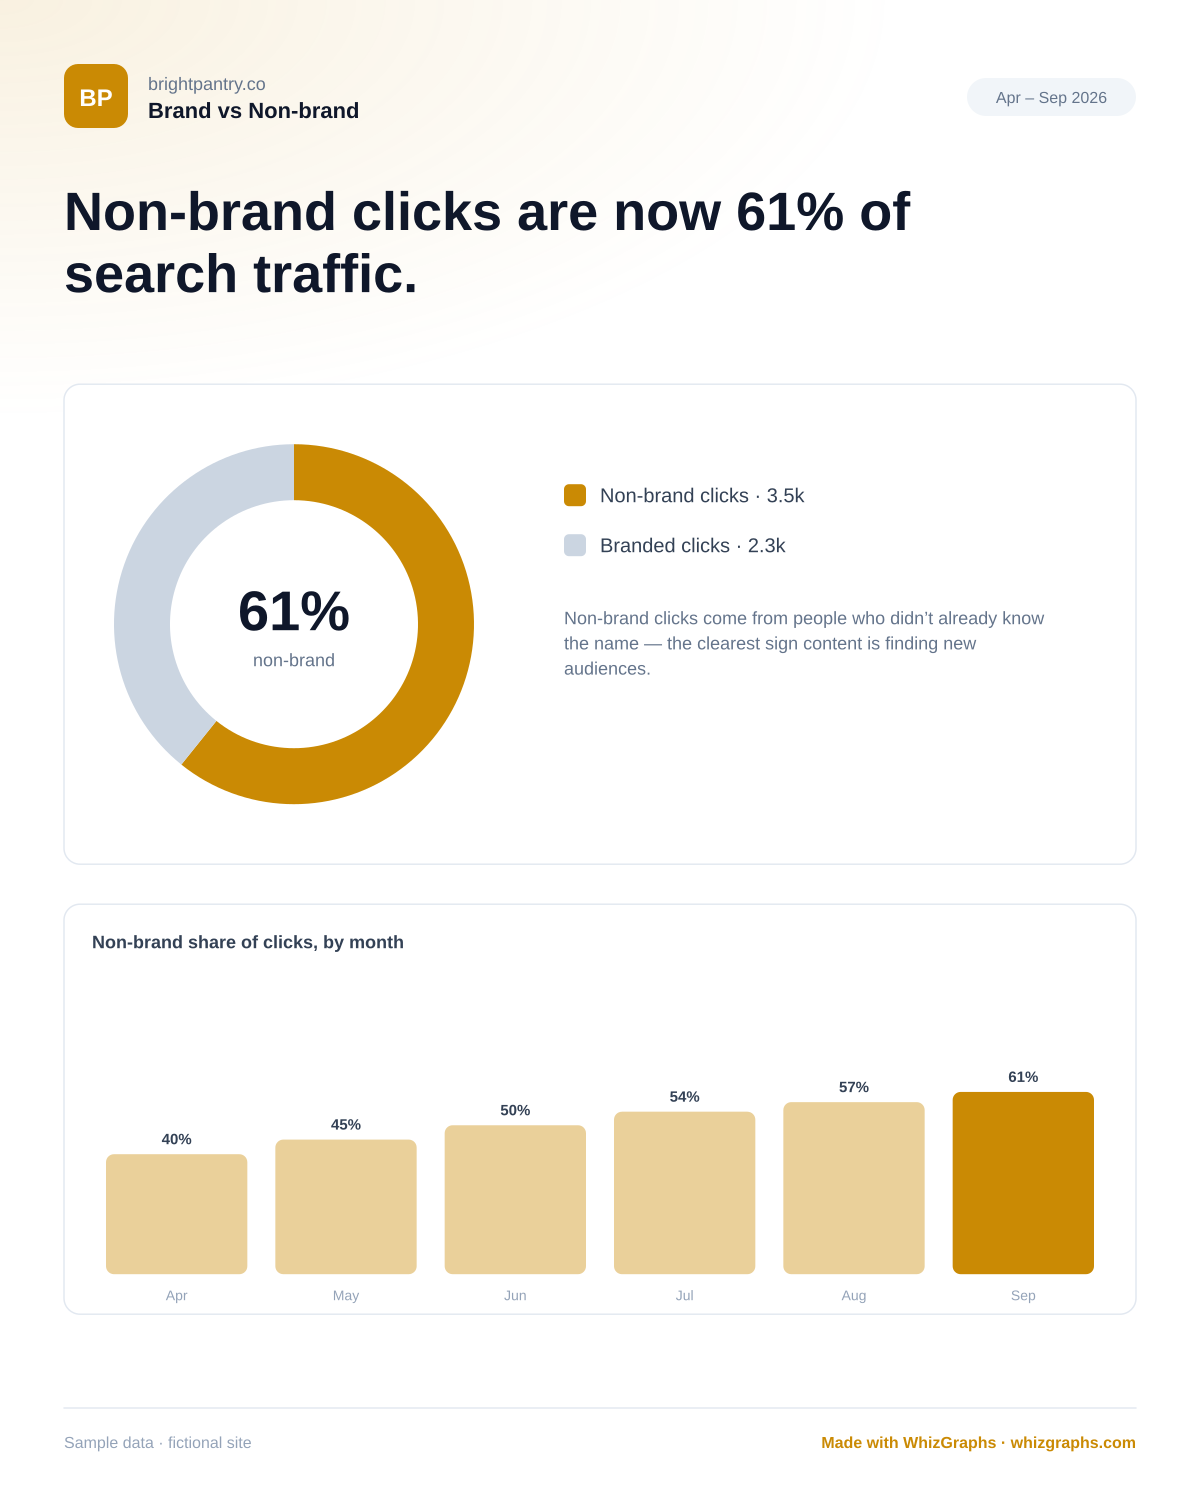
Non-brand clicks are now 61% of search traffic.
Branded vs non-branded clicks — is SEO reaching people who didn’t already know the name?
Why it works: Separating brand demand from discovery stops a PR spike from being mistaken for SEO progress.
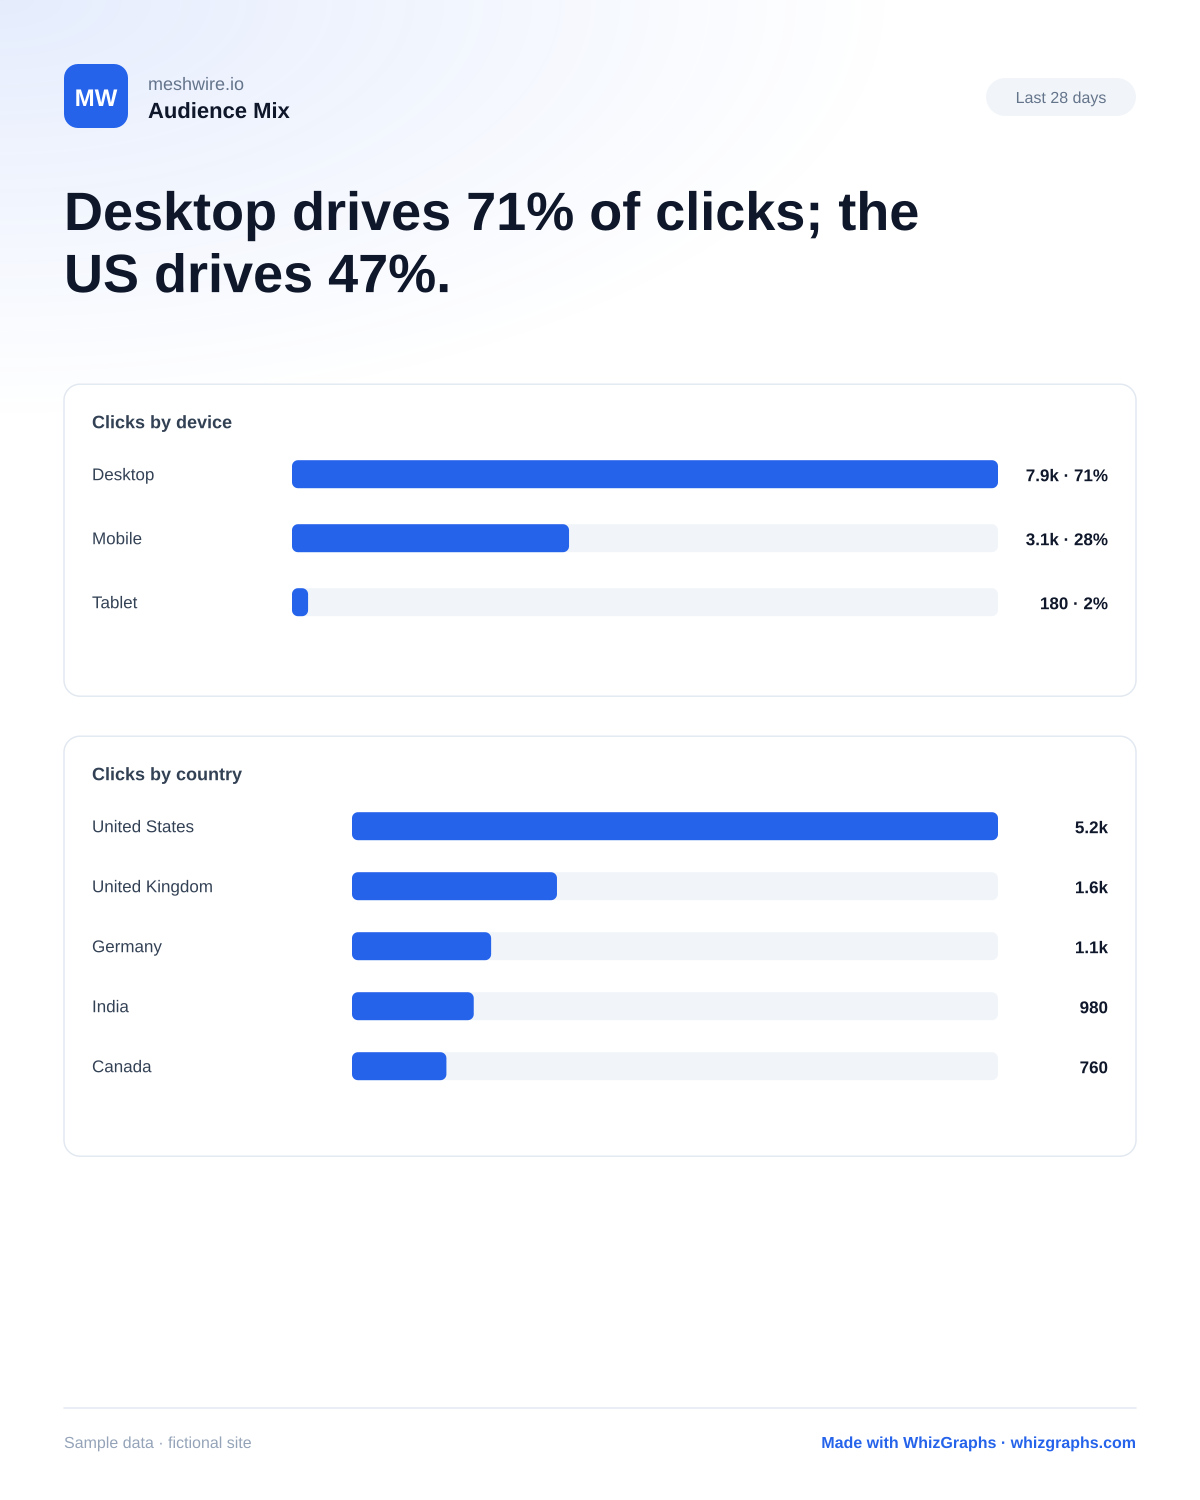
Desktop drives 71% of clicks; the US drives 47%.
Who searches, on what device, from where.
Why it works: A developer tool that’s 71% desktop can deprioritise mobile layout work — a decision the image makes in one glance.
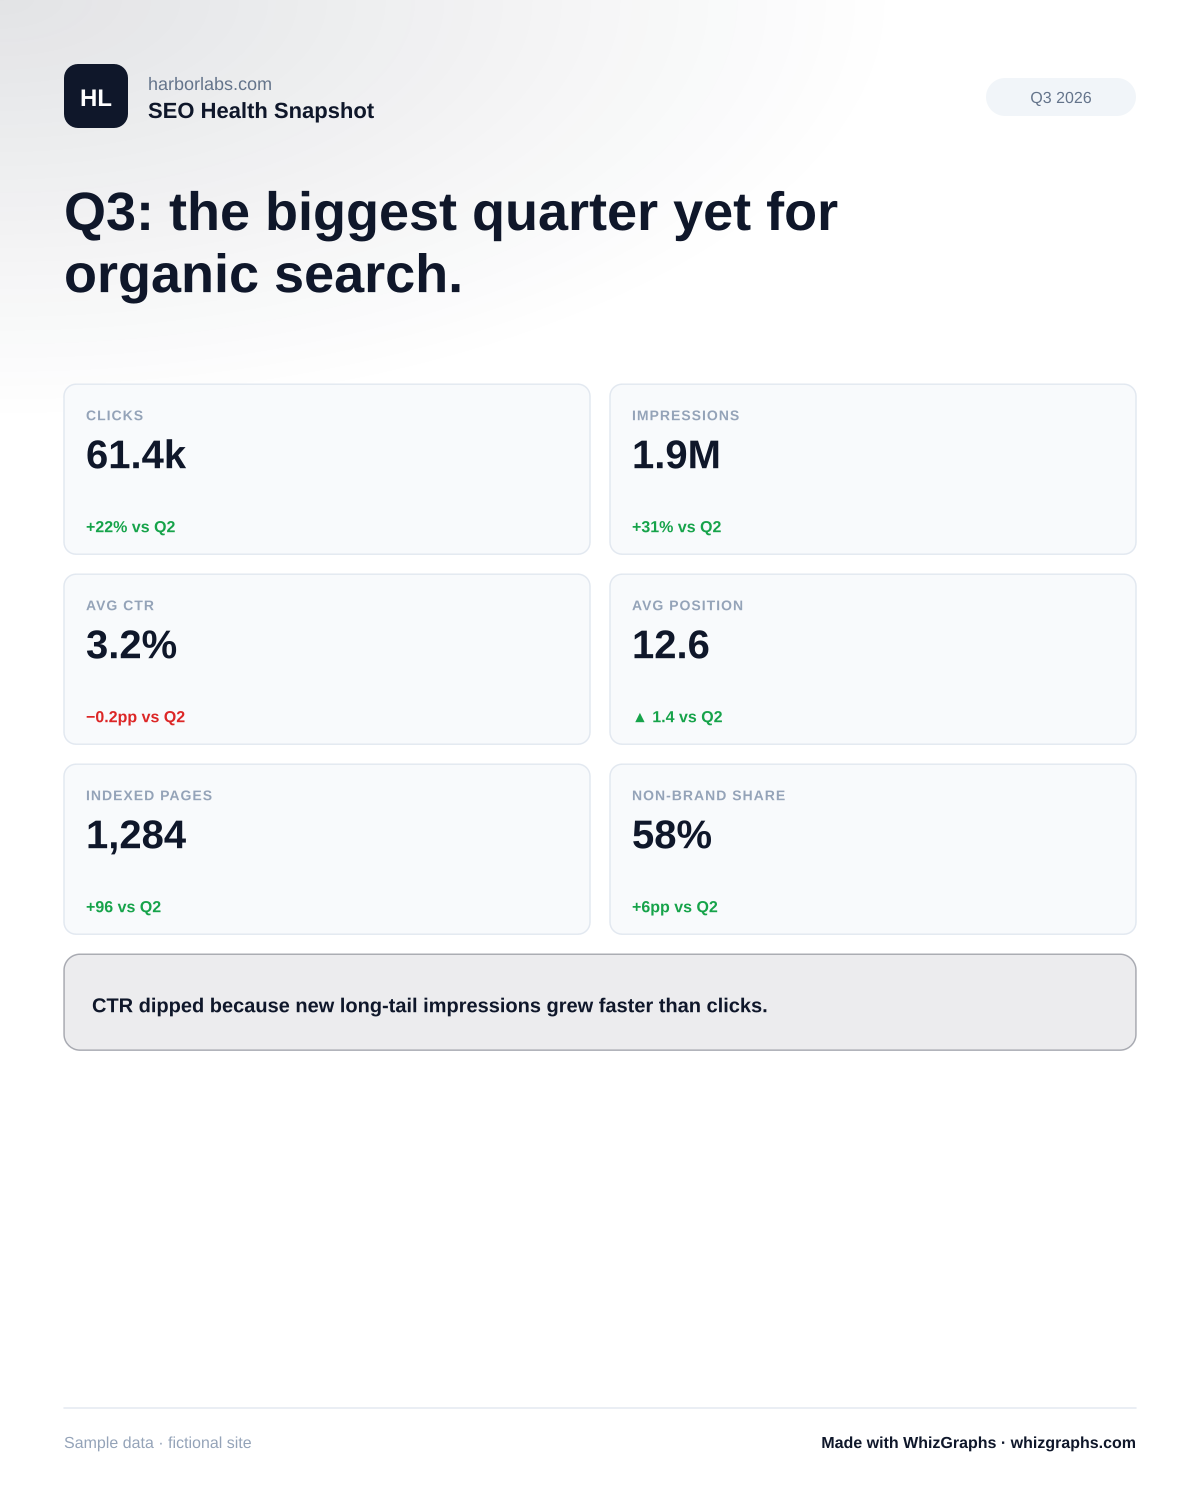
Q3: the biggest quarter yet for organic search.
The whole quarter as six numbers and a one-line verdict.
Why it works: It flags the one red number (CTR) and explains it in the verdict, so nobody panics in the meeting.
Six things every good example above does
The templates differ; the habits don’t. Use these as a checklist when you review your own SEO infographic before sending it.
Every example answers a single question. If you’re tempted to add a second chart, that’s a second infographic.
“Four queries reached page one” — not “Keyword rankings”. A reader who stops at the headline still gets the point.
Versus last month, versus January, versus the site average. A bare total can’t tell anyone whether things are good.
Site, period, and a “sample data” or source line travel with the image when it’s forwarded out of the original email.
The keyword example shows the query that didn’t make page one; the quarterly example flags the CTR dip. Credibility is the point of a report.
The CTR example says “rewrite five titles”. The best infographics make the next action obvious.
Which SEO infographic example fits your moment
Lead with ranking movement; explain any dip on the chart itself.
Momentum, and proof it’s new audiences rather than brand searches.
Where the cheap wins are: under-clicked pages and over-concentrated traffic.
Six numbers and a verdict, plus who the audience actually is.
Small numbers still tell a growth story — and set expectations about what Search Console covers.
From example to your own infographic in four steps
- 1
Pick the example closest to your question
Growth, concentration, movement, efficiency, or a snapshot. - 2
Export the matching Search Console data
Dates tab for trends, Queries for keyword wins and CTR, Pages for top pages. See the GSC infographic report guide. - 3
Rewrite the headline for your finding
Keep the structure — number, direction, period — and make it yours. - 4
Brand it, check it against the six habits, send it
Logo and color, then the checklist above before it goes out.
Frequently asked questions
No. Every example uses sample data for a fictional site, and says so on the image. The point is to show the format and the storytelling, not to publish anyone’s analytics or suggest benchmarks.
Yes. Each one links to a full-size PNG. Use them in presentations, pitches or articles about SEO reporting; if you publish one on the web, please link back to this page.
It answers one question, leads with a plain-language headline that states the finding, shows every number against a comparison, carries its own context (site, period, source), and points to a decision.
Each example is one WhizGraphs template with a different headline, brand color and data. Open the app, pick the matching template, and swap in your Search Console numbers — or rebuild the layout in your own design tool using the anatomy on the SEO infographics page.
Keyword Wins or Traffic Growth with annotations. For a fuller monthly document, the monthly SEO report template puts a month-over-month table, a 13-month trend and the gains and drops on one printable page.